Teaching Open Data for Social Movements:
a Research Strategy
Alan Freihof Tygel, Maria Luiza Machado
Campos, Graduate Program on Informatics - PPGI,
Federal University of Rio de Janeiro (UFRJ), Brazil.
Email: alantygel@ppgi.ufrj.br
Celso Alexandre Souza de Alvear,
Technical Solidarity Lab, UFRJ, Brazil.
INTRODUCTION
Since the year 2009, the release of public government data in open formats has been configured as one of the main actions taken by national states in order to respond to demands for transparency and participation by the civil society. The United States and the United Kingdom were pioneers, and today over 46 countries have their own Open Government Data Portali , many of them fostered by the Open Government Partnership (OGP), an international agreement aimed at stimulating transparency.
The premise of these open data portals is that, by making data publicly available in re-usable formats, society would take care of building applications and services, and gain value from this data (Huijboom & Broek, 2011). According to the same authors, the discourse around open data policies also includes increasing democratic control and participation and strengthening law enforcement.
Several recent works argue that the impact of open data policies, especially the release of open data portals, is still difficult to assess (Davies & Bawa, 2012; Huijboom & Broek, 2011; Zuiderwijk, Janssen, Choenni, Meijer, & Alibaks, 2012). One important consideration is that "The gap between the promise and reality of OGD [Open Government Data] re-use cannot be addressed by technological solutions alone" (Davies, 2012). Therefore, sociotechnical approaches (Mumford, 1987) are mandatory.
The targeted users of open government data lie over a wide range that includes journalists, non-governmental organizations (NGO), civil society organizations (CSO), enterprises, researchers and ordinary citizens who want to audit governments' actions. Among them, the focus of our research is on social (or grassroots) movements. These are groups of organized citizens at local, national or international level who drive some political action, normally placing themselves in opposition to the established power relations and claiming rights for oppressed groups.
A literature definition gives a social movement as "collective social actions with a socio-political and cultural approach, which enable distinct forms of organizing the population and expressing their demands" (Gohn, 2011).
Social movements have been using data in their actions repertory with several motivations (as can be seen in Table 1 and Listing 1). From our experience, an overview of several cases where social movements use open data reveals a better understanding of reality and a more solid basis for their claims as motivations. Additionally, in some cases data produced by the social movements was used to build a counter-hegemonic discourse based on data. An interesting example is the Citizen Public Depth Audit Movement which takes place in Brazil. This movement, which is part of an international network, claims that "significant amounts registered as public debt do not correspond to money collected through loans to the country" (Fattorelli, 2011), and thus origins of this debt should be proven. According to the movement, in 2014 45% of Brazil's Federal spend was paid to debt services.
Recently, a number of works tried to develop comparison schemes between open data strategies (Atz, Heath, & Fawcet, 2015; Caplan et al., 2014; Ubaldi, 2013; Zuiderwijk & Janssen, 2014). Huijboom & Broek (2011) listed four categories of instruments applied by the countries to implement their open data policies:
- voluntary approaches, such as general recommendations,
- economic instruments,
- legislation and control, and
- education and training.
One of the conclusions is that the latter was used to a lesser extent than the others.
Social movements, in general, are composed of people with little experience of informatics, either because of a lack of opportunities or of interest. Although it is recognized that using data is important for a social movement's objectives, the training aspect still hinders a wider use of it.
In order to address this issue, an open data course for social movements was designed. Besides building a strategy on open data education, the course also aims to be a research strategy to understand three aspects:
- the motivations of social movements for using open data;
- the impediments that block a wider and better use; and
- possible actions to be taken to enhance the use of open data by social movements.
The main reason that motivated our choice of driving an integrated approach between education and research was the need to create an environment of exchange. It is not uncommon to hear from social movements that researchers only use them for publishing papers. Beyond returning the results afterwards, our aim is to offer benefits at the moment of the research, and thus to create a better relation between researchers and participants, rather exchanging experiences than just collecting data.
This paper describes the methodology and the research associated with the development of an open data course for social movements, in the hope that this approach can be interesting to researchers and practitioners working in the Community Informatics field. In the sections that follow we first picture the open data scene and selected social movements in Brazil (where this research was undertaken); then we present some open data education experiences, and the methodological inspirations and research ideas that led to the development of the open data course. A detailed description of the course is followed by an analysis and synthesis of its outcomes, and conclusions.
OPEN DATA IN BRAZIL AND SOCIAL MOVEMENTS
In this section, a general panorama of open data in Brazil is given, together with some perspectives on the use of open data by social movements.
Open Data in Brazil
The first concrete action of the Brazilian government regarding the publication of data on the Internet was the Federal Transparency Portal, released in 2004. Even without using the term "open data", this initiative offered citizens rich information about public expenditure. The main goal of the Federal Transparency Portal is to fight corruption and misuse of public money. Besides the Federal Transparency Portal, all Brazilian states also have their own versions, as well as many cities.
Between 2004 and 2011, several legal instruments were published in order to create a political infrastructure to support a wider open data policy. Finally, at the end of 2011, Brazil joined the Open Government Partnership (OGP) and published its Freedom of Information Act (FoIA), the so called Access to Information Law (Brasil, 2011). However, a recent evaluation of the first two years under the law showed that only 69% of the demands received responses, and only 57% received satisfactory answers (Michener, Moncau, & Velasco, 2014).
Shortly after the publication of the FoIA, the Brazilian Open Data Portal was released. It is presented as a tool "for promoting dialogue between actors of the society and government, to establish the better use of data on behalf of a better society". At the present time, it numbers almost 500 datasets, and more than 4000 resources.
Open Data and Social Movements
A closer look at the activities of social movements reveals wide use of data in their discourses and forms of actions. Data is used to denounce specific situations, to attest the results of their actions and to understand the contexts where they are working. Table 1 shows some illustrative campaigns driven by social movements and identifies the data that was used.
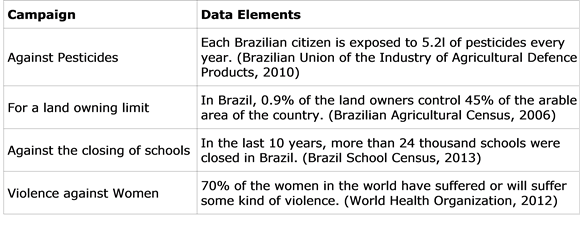
Besides those examples, where civil society organizations use official data to ground their discourses and claims, there is another use which is worth mentioning: social movements which produce data themselves. For example, Comissão Pastoral da Terra (a Christian service for rural areas), built a database of violent events in rural areas, and two maps of Environmental Justice, one covering the whole country, and another focused on the state of Minas Gerais. Moreover, the Solidarity Economy Movement promoted a mapping in Brazil which identified almost 22,000 Solidarity Economy Enterprises, whose basic aspect is the absence of an employer-employee relation, i.e., a self-managed cooperative model. This database was used to build the Cirandas.net system, the social and economic network of the Solidarity Economy Movement. (Tygel & Alvear, 2011).
With this outlook, we can conclude that data is an important element in social movements' elaborations. But some elements still hinder its use, in particular the lack of education and training.
EDUCATION IN OPEN DATA
A prominent initiative on teaching open data comes from the School of Data, an initiative by Open Knowledge and Peer 2 Peer University. The school works "to empower civil society organizations, journalists and citizens with the skills they need to use data effectively", under the slogan "Evidence is Power".
In 2014, the School of Data organized 90 events taking place in 30 countries, reaching over 2000 participants. Besides Europe, where most of them happened, School of Data reached places like Lebanon, Nigeria, Indonesia, Mexico, Brazil, Bosnia and Herzegovina, Tanzania and Philippines - training and exploring data about water, elections, and many other issues (School of Data, 2014). Open Knowledge offers courses in Germany, with a special focus on Data Journalism.
Initiatives on open data education have been reported in countries including the United States, the United Kingdom, Spain, Australia, and especially in Denmark, where the focus is on standardization of open data strategies between different government institutions (Huijboom & Broek, 2011).
Fioretti (2011) also notes the importance of using open data in schools, emphasizing that it could help connect school curricula with real life and stimulate active citizenship in the students. The need for some skills to understand data, such as mathematics, was also mentioned. Fioretti proposes two main lines of action: using open data, and producing open data as an official school policy.
POPULAR EDUCATION AS RESEARCH METHOD
Based on the previous discussion, we proposed and delivered an open data course designed for social movement activists. The course has its pedagogic foundation on the Popular Education theory (Freire, 2005), which suggests an emancipatory practice, where several kinds of knowledge are considered valid, not only the academic, and the knowledge building is a joint approach between educators and educandsii . The Popular Education starting point is the educands' context, experiences, and knowledge. This theory is grounded mostly on Paulo Freire, a Brazilian educator and philosopher, whose early work started with teaching the alphabet to workers in the north-east of Brazil, one of the poorest regions of the country, in the 1960's.
The main work of Popular Education is the book Pedagogy of the Oppressed (Freire, 2005), written in 1968 when he was in exile, ideologically persecuted by the civil-military dictatorship in Brazil. It was only published in his own country in 1974. Pedagogy of the oppressed was translated into more than 40 languages, and has already has 50 editions in Brazil.
To understand the concept of dialogicity (dialogue between ideas instead of imposition of one idea over another), it is worth citing Freire's analogy of the "banking" education iii :
For the anti-dialogical banking educator, the question of content simply concerns the program about which he will discourse to his students; and he answers his own question, by organizing his own program.
For the dialogical, problem-posing teacher-student, the program content of education is neither a gift nor an imposition - bits of information to be deposited in the students - but rather the organized, systematized, and developed "re-presentation" to individuals of the things about which they want to know more. (Freire, 2005, p. 95)
In the case of open data teaching, it is important to offer the student-activists, who already use data in their work, a systematized view of the whole process, and to present some tools that allow them to enhance their data based analysis and synthesis capacity. By understanding the context where people already use open data in social actions, it is possible to teach in a way based on students' interest in knowing more. Methodologies derived from Popular Education for open data teaching are explained in detail later.
Although it not was not fully applied in this research, the Participatory Action-Research (PAR) concept (Morin, 2004) also inspired this work. This methodological paradigm associates a transforming action with every research intervention, the planning and application of which should always be carried out with the researched subjects. Using the PAR perspective in community informatics research is a natural choice, since both approaches are centred in the community, both for practice and analysis.
In the community informatics field PAR was used to build a portal in a poor community in Rio de Janeiro, Brazil. In that case, research about community based organizations was the starting point to build a web portal run by those organizations (Alvear & Thiollent, 2011).
One of the main examples of PAR in Brazil is the work of Michel Thiollent, who suggests that action research
consists in coupling action and research in a process, in which the implied actors participate, together with the researchers, to interactively elucidate the reality in which they are inserted, identifying collective problems, seeking and experimenting solutions in real situations. Simultaneously, there is production and use of knowledge. (Thiollent, 2009, p. 14)
Fals Borda and Rahman (1991) also emphasize the importance of generating knowledge from practice in Latin American context. In this perspective, PAR is an appropriate methodology to generate knowledge for oppressed groups and social transformation. Finally, Baskerville (2007), within a more pragmatic North American PAR perspective, presents some possibilities for developing information systems using this methodology. Later, we discuss the research results gathered from the open data course according to a PAR perspective.
COURSE DESCRIPTION
Motivated by research on use and publication of open data by social movements and grounded on popular education principles, an open data course was developed. According to the dialogicity principle, the course objective is double: (i) to tackle the issue of open data education, indicated to be one of the factors hindering the use of open data; and (ii) to use the time in training to observe the activists using data and gather information for the research.
The course programme was elaborated seeking a balance between the social aspects of the use of data, the principal motivation, and the technical issues that are inherent in the tools for data manipulation. The methodology switches between expository stages and individual and collective activities by the students. It is expected that the students can at least achieve a critical view about data, understand the possibilities and limits of its use, be aware of the political questions involved in data production and publishing, and, finally, have a technical starting point for manipulating data.
The course is divided into four stages of four hours each, but can be adjusted to needs of the people involved. A website containing teaching materials, links to data sources, and a discussion forum was developed, which in each presentation of the course is supplemented with more data.
Only two requirements are asked of people interested in attending the course: a basic knowledge of informatics (web navigation) and access to a computer (which could also be offered by the organizers). Good quality internet access provided by the organizers is also highly desirable.
First Stage - Introduction
The first stage starts with a short description of the course, and the participants are informed that they will also be contributing to a research project. This stage is intended to get people on the same level, by discussing the sociotechnical and political aspects of data. The aim is to start from the educands' own experience, as suggested by the Popular Education approach. For this, all participants are asked to present themselves, state their expectations and why he or she decided to take part.
Afterwards, a challenge is proposed: some socially relevant statistical results are presented (see Listing 1), and the educands are asked to find the data sources related to those figures. Following the inverse path (information to data, rather than the opposite), we expect to raise curiosity and show, in practice, the importance of knowing what is behind the statistics.

In the sequel, several open data related topics are discussed:
- How does data arise: a data path is presented, from the occurrence of something, passing through its systematization to its publication. Concepts such as facts, dimensions, and measures are discussed, together with the political motivations and consequences of those design choices. This topic is intended to put data neutrality in question, by showing that data produced by research is an outcome of several choices, made according to some goal.
- Data visualization: the same dataset can be observed in many ways, and the conclusions to which one may come heavily depend on this. Visualizing data as tables, graphics, networks (graphs), or maps may reveal different aspects and induce several kinds of conclusions.
- Open Data: In this topic, we motivate the understanding of open data using analogies (see Table 2). In the sequel, we define open data according to the David Eaves' three rules: data must by findable in the Web, published in machine readable formats, and cannot have licenses which prevent re-use (Eaves, 2009). A debate about linking and semantically marking data through the use of Linked Open Data (LOD) is also proposed with examples.v
- Transparency Policy: At this point, we present the context of open data in Brazil and in the world, especially through transparency policies. It starts with the Freedom of Information Act (FoIA), and goes up to Internet governance, with the recent Brazilian regulationiv based on three foundations: net neutrality, privacy and freedom of expression. International efforts on transparency, such as the Open Government Partnership (OGP) are also presented.
- Synthesis: After presenting all topics, educands are asked to discuss how open data is related to their activism.

Second Stage - Data Sources
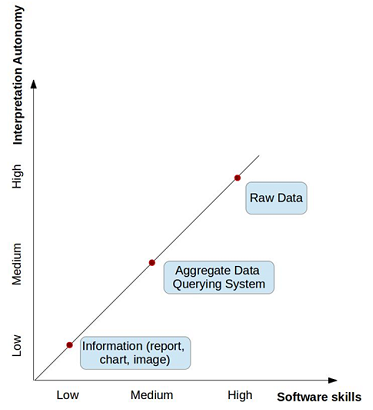
The second stage of the course is dedicated to an overview of some important datasets on the Internet. It is worth noting that some of them are not "open" by the classical definition (Eaves, 2009), mainly because the raw data is not available for download. However, when an aggregate data querying system is offered, it makes data even more useful for common user than if raw data was available.
Different forms of accessing data are discussed. We recognize that, in respect to data access means, there is a trade-off between the ease of analysing data and the autonomy one can have in assessing one's own conclusions. When a database is published as raw data, following all open data principles, this still might not help a citizen who wants to know how much was spent on education is his city. Large volumes of data coded in specialized formats (e.g. R, SPSS, SAS, SQL, XML, RDF) allow a high level of autonomy in the analysis, but special skills are needed to work with it. On the contrary, aggregate data, reports and charts allow people to have access to this information, but it has already passed through someone else's filter. Figure 1 depicts this debate.
Besides the means of data access, we propose a classification of data according to the type of provider:
- Data produced by the state: This is the wider category, since the state has structural conditions and legal liability to produce data. In Brazil, the biggest data producer is the Brazilian Institute of Geography and Statistics (IBGE, in Portuguese), responsible for demographic, economic, geographic and many other sorts of data. The Unified Health System (SUS, in Portuguese) is also an important data generator, mostly about health and illnesses. Worldwide, the United Nations (UN) and the World Bank are also important data suppliers. Even though they are not governments, most of their data is compiled from country data. It is important to emphasize that this kind of data carries with it the visions and ideologies of those who generated it. All the design choices made during the data production, including definition of facts, dimensions, and measures, in some degree follows the government intentions.
- Data produced by the state and shown by society: In many cases, data produced by the state is not open, and when it is open, there are no tools for the citizens to easily analyse and take their own conclusions. Specialists are needed in order to translate data into useful information. In order to tackle this issue, many society-driven applications using official data have been recently released. In many cases, they help visualize data in a way that leads to conclusions against the states' interest. One example is the Brazilian's "Congress Owners" application. Based on raw (and hard to analyse) donation data published by Electoral Justice, a civil society organization has developed an application where people can easily access and visualize the amount of donations received by politicians and parties, or paid by enterprises or economic sector.
- Data produced by society: The case where organized groups of the civil society produce their own data is interesting because: (i) as in the case of state data, data produced by the civil society contains its ideological influences in the design choices; (ii) it allows other perspectives on subjects already explained by the state.
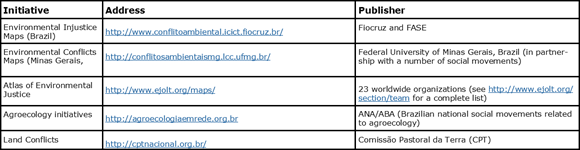
Data related stories can oppose well established hegemonic opinions. One example is the Brazilian Map of Environmental Injustice. Agribusiness is considered to be a good development alternative for the country, based on its relevant contribution to the gross domestic product. The map shows 82 occurrences of Environmental Injustice related to the agribusiness (from a total of 501), where activities of this sector cause damage to poor communities and/or to the natural habitat. Table 3 shows a number of society driven databases. It is worth noting that, in some cases, the funding for building those databases comes from the Government. In principle, we consider that this does not hurt society's autonomy and freedom to put their views forward in the design process.
In the final activity of this stage, educands are asked to add new data sources to the course web page, according to their interests. New sources can come from students' experiences, or be searched for during the class time. However, it is important to find the exact link, since this is reported to be a difficulty, as it will be seen later.
Third Stage - Tools
In the third stage, the focus is on tools for manipulating data. The goal is to present the means to work with the raw or aggregate data resulting from queries. It begins with an introduction to the Comma Separated Values (CSV) format, which is an open, universal and easy-to-use way of exchanging tabular data. Concepts such as primary and foreign keys are also discussed, in order to help comprehend how relationship between tables and databases can be made. Nevertheless, database design is beyond our scope.
This is an essentially practical stage. Several tools are presented, so that each student can choose which one he or she wants to work with, according to individual interests and ability with computers.
The first tool presented is a spreadsheet editor. The task consists in downloading a CSV sheet with a two dimensional table (production of food in tons, by type of food and year) and drawing a line chart. Students are also asked to plot percentage changes between first and last year production. The second part of the task consists in working with dynamic tables, which allows building analysis frameworks with more than two dimensions.
Other tools presented are related to map building and infographics drawing. Sometimes a mathematical background revision is necessary, since working with number variations requires some previous knowledge of percentages.
Fourth Stage - Final Work
The fourth and final stage is dedicated to a jointly decided activity. The goal is to develop some data based communication product, based on the three previous stages. Ideally, there should be more than one facilitator in the room, so that the work can be divided into groups, with each group being accompanied by one instructor.
Suggested options include: writing news text based on data, and building infographics and maps on specific subjects. The intentionality - what and why we want to communicate - is discussed first. Then, we evaluate the feasibility of the task - is there data about this subject? - and finally, the communication instrument is chosen. In the end, results are presented and an evaluation of the course is done.
The next section brings an analysis of presentations of this course, and draws out some research results based on the experiences gained.
COURSE ANALYSIS
The course described above was presented five times in the second semester of 2014, in Brazil. While three presentations happened in Rio de Janeiro, one was held in Vitória (state of Espírito Santo) and another in Porto Alegre (state of Rio Grande do Sul). Two presentations were held in a workers union and three in universities, organized by groups who work with social movements in extension projects. A total of 52 students enrolled and participated in at least one stage. There were no fees to pay, and the only requirements were basic informatics knowledge and access to a computer, sometimes provided by the organizers. Table 4 shows a summary of the presentations.

The analysis will be based on two instruments: an evaluation questionnaire that all students were asked to fill in, and a participant observation gathered during the presentations. The goal of the analysis is to respond to the research questions: (i) why social movements use data (motivations); (ii) what are the mains problems (impediments); and (iii) what could be done to enhance the use (improvements). Also, the evaluations about the course can be used to improve it.
Questionnaire Based Analysis
All the participants were requested to answer a questionnaire after attending the course. Thus, we assume that the opinions given are strongly influenced by the discussions held over the course. This decision was taken having in mind that: (i) open data is not a subject of the educands' everyday life; so, answering before the course could lead to meaningless results; (ii) according to the popular education methods, we expect each educand to be able to relate content unseen before with their experiences, and in the end to synthesize their own conclusions about the process. Table 5 shows the questionnaire and the mean, maximum, and minimum values for numerical questions.

All the numerical results are in over a base of 15 (n = 15), and N/A means "not applicable".
The median age of participants was 31 years, with the youngest being 25 years old and the oldest 48. They considered themselves to have medium knowledge of informatics. Before enrolling, participants were asked to have some informatics knowledge, but no admission tests were given.
Some participants were exclusively activists or academics, but most of them were activists with some academic involvement. There were journalists, lawyers and social scientists, all engaged with some social movement. No participant had formal informatics training, meaning that no one was an informatics expert.
The teacher's performance was well rated, but this was somehow expected in a free course. On the other hand, no one rated him or herself with very good participation performance. In Question 7, only one participant seemed to have very different expectations about the course content. All the others marked 4 or 5, indicating that open data is not so distant from non-informatics people's lives, at least for those who answered the questionnaire.
In order to analyse questions 4, 8 and 9, we will pick answer elements and classify them according to research goals: motivations, impediments, and improvements. Question 4 was aimed to catch motivations, but impediments and improvements were also cited. Question 8 raised only impediments, and Question 9 only improvements, as intended.
An effort was made to extract concrete elements from the discursive text. An equilibrium was sought between merging similar statements and not losing the diversity of opinion. These concrete elements extracted can be seen in the Appendix, in Tables 6, 7 and 8.
Sometimes, the separation between the classes is not very clear. All impediments (e.g. "Open Data Portal is hard to use") have implicit improvements (e.g. "Open Data Portal could improve usability"), as all improvements also have implicit impediments. Some motivations (e.g. "Use spending data to fight corruption") also could be interpreted as impediments (e.g. "Few spending data is available") or improvements (e.g. "More spending data must be made available"). We tried to classify according to the respondent's intention.
Observation Based Analysis
In this section, some remarks are made based on the 68 hours observation of the course. This observation was driven inspired by the ethnographic method of participant observation (Atkinson & Hammersley, 1994). Within this approach, the researcher plays an established participant role in the studied scene, in this case, as an educator, taking field notes during the class. Ethnography inspired methods are complementary to objective and quantitative evaluations since, according to Atkinson & Hammersley (1994), ethnography deals with the "analysis of data that involves explicit interpretation of the meanings and functions of human actions", and "represents a uniquely humanistic, interpretive approach, as opposed to supposedly 'scientific' and 'positivist' positions." Since two of our research questions deal with human actions and feelings - what are the motivations of social movements for using open data and what are impediments that block a wider and better use - we considered the participant observation an appropriate methodological direction. We aimed to comprehend the point of view of the educands, and this was done from the educator stance, which certainly influenced the analysis.
As described earlier, in the first stages of the course participants are shown statistical statements (see Listing 1) and are asked to search for data that generated those figures. Below, we list some behaviours observed:
- The first impulse of users is to paste the phrases directly into a web search engine. Normally, the results are news commenting that statement, or reports containing that information, and never the actual data source.
- For some people, it is difficult to understand the difference between the statements and the data sources from which they were originated. One way to overcome this misunderstanding is to slightly rephrase the statement and ask what would be the new figures. For example, relating to statement 1 (Listing 1), we would ask: "how much land do the 0.1% of the biggest landowners possess?".
- Overall, only few people reached the actual data source. This shows that one of the main problems of data sets and their query/download systems is that they are frequently hidden in the deep web, i.e., regular search machines cannot find them.
In the second stage of the course, some data sources are presented and divided into three categories. About this stage, we would like to remark:
- In general, although interested, users are unfamiliar or unaware of data sources. This ignorance is, as expected, worse for society driven OGD based applications, and for data produced by social movements, which usually have no official means of dissemination;
- Students were stimulated to add new data sources to the course website, according to their own interests or activism. In some cases, participants inserted already known data sources, but in most cases data sources were found during the activity.
The third practical stage revealed one of the strongest difficulties in open data usage: the manipulation of software tools, particularly of spreadsheets. The knowledge about CSV tabular files, considered as a fundamental skill to use data on different systems, was practically absent. This problem got even worse because of the inability of the most-used proprietary spreadsheet application (MS Excel) to deal with such kind of file. LibreOffice, its open source counterpart, facilitates this task.
Another issue that was highlighted at this stage was the mathematical difficulty faced by most of the students. Dealing with statistical open data requires, most of the time, simple mathematical operations. Therefore, sometimes a small revision of percentage was necessary.
Unfortunately, the fourth stage of the course did not work as expected. This stage was only reached in two of the five presentations described in Table 4. In the first one, students, mainly journalists, decided to individually write stories and impressions about open data. They were published in the course website. The second experience reached closer to the goal: participants decided to investigate a local case of environmental injustice. Data about enterprises, population health, environmental licensing and other issues were gathered, but no final product was obtained. In the remaining three presentations, the time ran over twice, and once the students said they were tired, as this course was run on two full days, at a weekend.
One possible way to overcome this issue is to propose this work at the beginning of the course and organize tasks during the other stages. This has the advantage of motivating students with a concrete problem during the course. Nevertheless, the challenge remains: how to prepare the course without predefining the problem. Another option would be to increase the number of hours, which would depend on participants' availability.
Synthesis
As explained above, by a simple rephrasing, an impediment or a motivation can turn into an improvement. By doing a careful analysis of Tables 6, 7 and 8 (see the Appendix), an improvement classification tree was built. It is aimed at orienting actions for the engagement of social movements in open data in the Brazilian context. The classification tree can be seen in Figure 2.
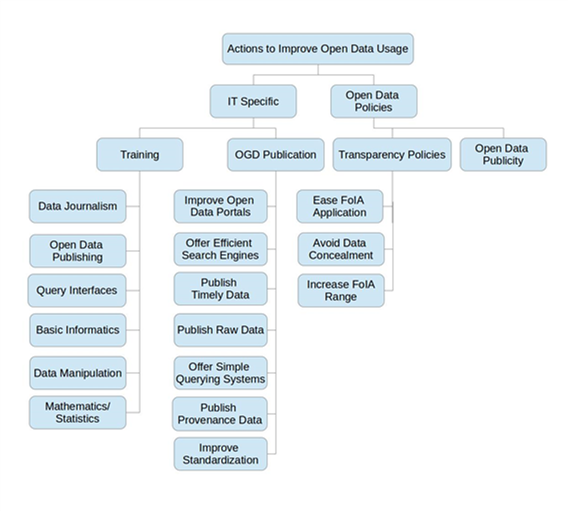
The first classification is a distinction between Information Technologies (IT) Specific and Open Data Policies related issues. There is no intention to imply a duality between social and technical issues, however, one can easily recognize that some elements are directly related to information technology, and others are not.
The IT Specific issues are divided into Training and Open Government Data (OGD) Publication. The first class encompasses cited impediments which could be approached with educational investments, and the second is related to actions to be taken by government data publishers. Our proposed course tackles all cited educational demands, except data publishing, since it still demands a higher level of informatics knowledge. As to OGD Publication related issues, the need for better search engines was the most cited enhancement.
The right side of the tree presents general issues related to Transparency Policies and Open Data Publicity. We can conclude that in order to improve open data usage, actions must be taken far above data level. In this case, the whole structure for information access must be enhanced. Difficulties in claiming the FoIA within local government levels were reported, as well as accessing information on private foundations that run on public money. Finally, many participants suggested that more publicity on open data already available would also improve usage.
CONCLUSIONS
This article described a methodological strategy used in research on Open Data and Social Movements. An open data course was proposed in order to help understand the motivations for the use of open data by social movements, the impediments to succeed with this, and the improvements that could help the engagement of society by means of open data.
The results of five presentations of the course were organized into a classification tree of possible open data engagement actions, shown in Figure 2. Training related actions should be fostered as part of a Transparency Policy, but social movements should also prioritize open data in their agenda.
Some improvements related to OGD publication could be addressed by using new technologies being developed under the Linked Open Data (LOD) framework. By semantically annotating data with commonly used vocabularies and ontologies, the LOD approach offers the technical means to link different data sources and jointly query them. A solid set of tools to implement LOD is being developed (Auer, Bryl, & Tramp, 2014), but strong efforts must be made to hide the complexity of the representation and to highlight its benefits, so that it can be recognised as a viable option. Other improvements are only possible through the effective political willingness of governments to be transparent.
As a methodological approach for research in informatics, the course was found to be an efficient tool, since it accomplished its dialogical function indicated by the Popular Education theory. At the same time as they were subjects on an open data education action, the educands that participated on the course acted as objects in a research project. On one side the dialogical approach resulted in a set of appointments for open data publishers; on the other side, in a satisfactory educational experience, as shown by the good educator evaluation (Table 5) and by the rich answers collected (Tables 6, 7 and 8).
The open data engagement actions gathered here are not supposed to be complete. The methodology used to raise these actions allows only to affirm that they can improve the use of a specific actor, a social movement, that thinks about open data with a special intentionality. Nevertheless, our efforts add to a number of other initiatives (Atz et al., 2015; Davies, Fernando, & José, 2013; Gurstein, 2011; Ubaldi, 2013; Veljkovi?, Bogdanovi?-Dini?, & Stoimenov, 2014; Zuiderwijk & Janssen, 2014), encompassing other actors, and aiming to picture a desired open data scenario in the future.
ACKNOWLEDGEMENTS
A. Tygel is supported by CAPES/Programa de Doutorado Sanduiche no Exterior grant 99999.008268/2014-02. M. L. M. Campos is partially supported by CNPq-Brazil.
We would like to thank all the educands who took part in the courses, and especially to the organizers of the 5 presentations: Journalists' Union of Rio de Janeiro, Citizenship University/Federal University of Rio de Janeiro, ORGANON (Federal University of Espírito Santo), and GPACE (Federal University of Rio de Grande do Sul), all in Brazil. We are also grateful for the valuable contributions of the editors and reviewers.
ENDNOTES
i According to http://data.gov/open-gov/,
accessed on 26/12/2014.
ii Freire proposed the terms educator and
educand in order to express the dialectic relationship
between them in the knowledge building process, in
opposition to the typical oppressive relationship between
'teacher' and 'student'.
iii In Freire's work, the "banking" education
concept occurs when "education becomes an act of
depositing, in which the students are the depositories
and the teacher is the depositor. Instead of
communicating, the teacher issues communiques and makes
deposits which the students patiently receive, memorize,
and repeat." (Freire, 2005, p.72)
iv An English version of the "Marco Civil da
Internet" can be found at
http://publicknowledge.org/documents/marco-civil-english-version
REFERENCES
APPENDIX
|
Question 4: Why have you attended to the course? Why do you think open data is important? |
|||
|
# |
Motivations |
Impediments |
Improvements |
|
4.1 |
Work with data and link different information to create arguments |
There is a mismatch between amount of data released and the capacity of social movements to analyse it |
Make investments in education for open data use |
|
4.2 |
Be able to work with data driven journalism |
There are many barriers to access information |
Promote publicity about existence of data |
|
4.3 |
Use data to denounce injustices |
Open Data is unknown for most social movements |
Improve knowledge about how to search for data |
|
4.4 |
Data can give basis to stimulate new claims |
There is no full transparency in government actions |
Enable access to information, without discrimination |
|
4.5 |
Translate data into information for readers |
Most of the people have little informatics ability |
|
|
4.6 |
Produce data in juridical research |
||
|
4.7 |
Open data can stimulate analysis |
||
|
4.8 |
Open data can stimulate new data |
||
|
4.9 |
Validate/legitimate arguments in communication with data |
||
|
4.10 |
Use data to understand the capitalist society |
||
|
4.11 |
Understand the resistances against oppression with data |
||
|
4.12 |
Fight corruption using spending data |
||
|
4.13 |
Make better use of information, a central point in class conflicts |
||
|
4.14 |
Unveil data manipulation |
||
|
Question 8: What is the main impediment perceived by using data? |
|
|
# |
Impediments |
|
8.1 |
The lack of knowledge about data production process makes interpretation difficult |
|
8.2 |
It is hard to understand data connection and linking possibilities |
|
8.3 |
Finding data in the web is hard /Open data portals are complicated |
|
8.4 |
Access to data outside the web is hard / FoIA application is complicated |
|
8.5 |
Data organization is confused |
|
8.6 |
Data formats does not help its use |
|
8.7 |
The state presents data through different platforms, which increase the need for training |
|
8.8 |
The need of specific software tools makes data usage harder |
|
8.9 |
Some important data is concealed |
|
8.10 |
Most data is outdated |
|
8.11 |
The querying interfaces present too much information |
|
8.12 |
Access to raw data is hard |
|
8.13 |
Government agencies do not follow common data standards |
|
8.14 |
Data interpretation is difficult, especially on specific subjects |
|
8.15 |
Linking data from different sources is difficult without appropriate tools and metadata |
|
Question 9: How do you imagine that the use of data could be improved? |
|
|
# |
Improvements |
|
9.1 |
Provide user-friendly interfaces |
|
9.2 |
Provide education on statistics/mathematics |
|
9.3 |
Standardize open government data |
|
9.4 |
Provide user-friendly language (avoid technical terms) |
|
9.5 |
Provide wider training possibilities |
|
9.6 |
Promote more advertising of open government data initiatives |
|
9.7 |
Promote more advertising of social movements open data initiatives |
|
9.8 |
Foster more research on open data and social movements |
|
9.9 |
Improve data search engines |
|
9.10 |
Increase the offer of open data sources |
|
9.11 |
Avoid the need of intermediaries for data interpretation |
|
9.12 |
Improve open data portals |