Qualitative Research Without Money: Experiences With a Home-grown Qualitative Content Analysis Tool
Adjunct Professor of Information Management, Faculty of Informatics and Design, Cape Peninsula University of Technology, South Africa. Email: andy.bytheway@gmail.com
BACKGROUND
Even if they receive bursaries, a majority of research students in South Africa (and many elsewhere) work with very little money to cover their research expenses. This is a small but significant feature of the digital divide that denies access to resources that are needed by those living and working in difficult circumstances.
The research tools that are commercially available are impossibly expensive for the average research student on the African content and therefore remain a dream for many of them. It is surprising that many African Universities have not yet undertaken to provide the sorts of facilities that are widely needed, by means of "site" licences, thus leaving each researcher to do what they can, within their own resources. But there is another perspective on the use of these tools that does not concern funding: experience with two commercially available qualitative research tools (in two doctoral and two masters research projects) suggests that sometimes little of value is actually gained. This is not an indictment on the capability of the tools, rather it is a comment on the ability or willingness of researchers, and their supervisors, to step up and develop a proper capability to learn about and deploy these tools effectively. This may be something to do with problematic educational backgrounds (on the one hand) and needless complexity and sophistication of the software tools (on the other), but what is certain is that these tools are quite outside the capability of a researcher using the standard personal-productivity "office" suite. A combination of research and data management competencies seems to be essential, more than come from routine personal use of a PC for research purposes.
This is not a research paper, and so there is no attempt here to provide the detailed evidence that would substantiate these perceptions of difficulty. Instead, the paper reports on one initiative that took a pragmatic stance, looked inquisitively and critically at the actual capability of the Microsoft Office suite, and set out to develop a basic tool - the "Qualitative Content Analyser" - that could match the essential features of the commercially available packages, and be made available to research students at no cost. As will be shown, this was a successful initiative that brought useful and unexpected benefits.
RESEARCH IN A DISADVANTAGED CONTEXT
Four research projects in Cape Town each presented a relatively large volume of research data that needed to be analysed:
- a funded study of teaching with technology in six schools in Cape Town,
- a masters study of e-Participation (also in Cape Town),
- a series of conversations with educators in different countries around the world, and,
- a doctoral project looking at the "Africanisation" of South African retailers.
Taken together, these projects led to a volume of interview data that took some hundreds of hours to transcribe and that challenged all those involved to analyse the data so as to begin to produce useful outputs. Working all of the potential meaning out of the evidence remains a task that is yet to be completed. The "teaching with technology" project alone generated some 52 interviews that required more than 400 hours of team effort to transcribe. In each of these cases, the prototype "Qualitative Content Analyser" was used and allowed useful outputs to begin to be produced.
This was the context for the project. The remainder of this paper now reviews qualitative research (in the briefest possible way), examines the tools that are available to support it (including the new analyser), and presents some evidence as to how it works and what it does for the researcher.
QUALITATIVE RESEARCH (IN A NUT SHELL)
To find standard texts on the origins of research in the social sciences we must reach back to the 1980s and beyond (for example Rummel & Ballaine, 1963, and Howard & Sharp, 1983, as cited in Gill & Johnson, 2002), but some of the earliest work that laid foundations for modern qualitative analysis can be attributed to Schutz (Schutz, 1959). At a time when our understanding of data structuring and concepts of data normalisation were at best primitive, Schutz based his explanation of qualitative analysis around something he called the "denotatum" (plural "denotata"). His essential idea was that when we study something - typically text but possibly images or other sources - we recognise an idea, or a concept, that is denoted by a short section of the text or by elemental ideas that the evidence signifies. His ideas positioned the denotatum as a "first order construct", that denoted a more significant thing we can refer to as the "second order construct" - what today we call a "category" that can be designated by a "code". Some of Schutz's more interesting work concerned the reliability of categorisation, and he argued that in order to attribute a category to the source (through the denotatum) it is necessary to have "criteria" that validate, or legitimise, the attribution.
In an example dealing with the categorisation of comic strips in the USA, he developed a tree structure where each node becomes the criterion for the next categorisation:
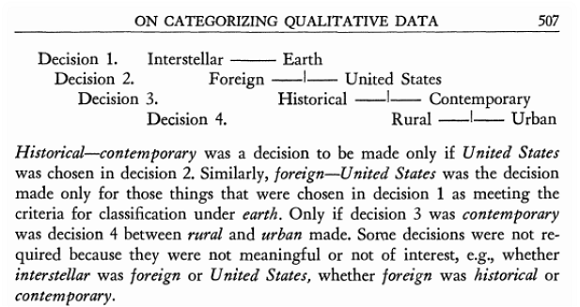
For the present purpose we can avoid a discussion of why Schutz might have wanted to do this research, but we are reminded how tortuous things were in the 1950s; not only is Schutz unable to refer to the idea of the "binary tree" to help us understand how he is thinking, the typesetter must have worked for some time to lay out the words and lines in the original figure. Nevertheless, this is an interesting indication of what was to come - that we would want open-ended tree structures and networks to accommodate the complex coding structures of modern social research.
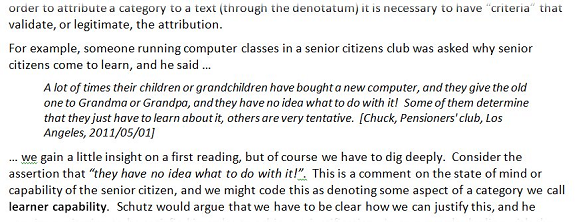
If we refer to a more recent example, in a series of conversations with educators around the world (that we will see more of later) a retired engineer running computer classes in a "senior citizens club" in the USA was asked why senior citizens come to learn about computers, and he said ...
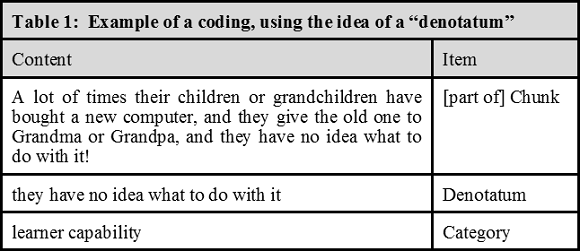
A lot of times their children or grandchildren have bought a new computer, and they give the old one to Grandma or Grandpa, and they have no idea what to do with it! Some of them determine that they just have to learn about it, others are very tentative. [Retired Engineer, Pensioners' club, Los Angeles, 2011/05/01]
We gain a little insight on a first reading, but of course we have to dig deeply to get the most from a monologue such as this. Consider the assertion that "they have no idea what to do with it!". This is a comment on the state of mind or capability of the senior citizen, and we might code this as denoting some aspect of a category we call learner capability. Adopt the terminology first used by Schutz, wherein he uses the word "denotatum" to indicate the unit of meaning that associates a chunk of text with a category, we summarise the categorisation thus:
Of course, whether you consider "learner capability" to be an arbitrary idea, or something already defined by specialist educators, or something that needs to be measured in a quantitative way, all depends on the definitions of the categories in use and the objectives of the research. And there are many other meanings in this short extract, even to choose just the words "new computer" puts a whole different slant on things, hinting that there are issues of technology availability, ownership and use. These open questions are indicative of the mental gymnastics that every qualitative researcher has to go through and they justify what Strauss and Corbin refer to as "micro analysis" (Strauss & Corbin, 1998, p.p.57 et sec) - the minute examination of and reflection on, every word and phrase in a text, and every possible meaning.
In the example of the senior citizen's club, we might find from a reading of the full transcript that the structuring of categories in the way that Schutz did it is something like this:
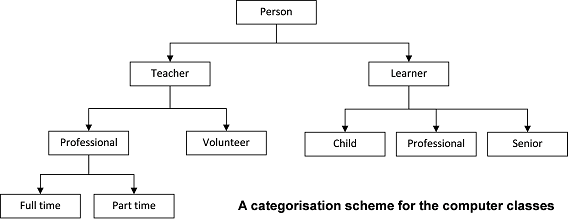
But immediately we can see some of the issues. This is not just about binary trees, a "parent" node might have many "children". There might be many levels. Some concepts recur, as in the case of Professional (which occurs on both sides). Some are singular (Teacher, Learner) but some are quantifiable and may have to be further refined to indicate how many hours are available (Full time, Part time), or into what kind of "part time" they fit. Then, we realise that all we actually have here is demographic data, and it hardly begins to touch the issues of why Gramps comes to class, and what his children's children had to do with it.
THE STATE OF PLAY TODAY
It is surprising that many of the standard texts on research methods pay so little attention to this question of coding and categorisation. To take a small sample (conveniently located on the shelf at the author's left shoulder) some books make no mention of coding at all (Huysamen, 1994; Gill & Johnson, 2002) and others reduce it to a single entry in a glossary in an appendix (Saunders et al., 2009); One useful source when getting started is Anol Bhattercherjee's free-to-download book that introduces social science research (Bhattacherjee, 2012), wherein he explains some of the basics. But the definitive text book that is usually referenced today, is based in Grounded Theory and takes a broad sweep across the length and breadth of qualitative research (Strauss & Corbin, 1998). Even though Strauss and Corbin offer the "basics of qualitative research" their treatment of coding is extensive, detailed, and quite forbidding to the novice researcher who has no experience of the qualitative research and its practice.
Hence, a serious problem faced by research students is the huge variety of possible sources of help and guidance concerning qualitative content analysis methods, the wide variation in approach, and the lack of detail or practical advice. At one end of the spectrum is the sometimes fierce academic debate around Grounded Theory (Glaser & Strauss, 1967), at the other are the summary overviews specifically written for students (such as Saunders et al., 2009 - already quoted). At the seriously academic end of the business of research the long-term debate about the place of qualitative research in the wider milieu of information systems research continues (Myers & Klein, 2011). Some of the clarity that was offered in the early days by Schutz and others has been lost in the more recent debates; when one looks at specific examples (Graneheim & Lundman, 2004) it is not at all clear that the application of the approach is done with sufficient clarity and discipline.
So, What Are Research Students To Do?
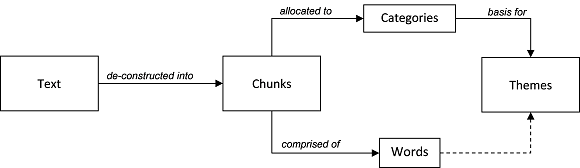
At the heart of qualitative research is the material that comes from interviews, documents, and correspondence. In the simplest possible terms, the analysis of the data that comes from this kind of research is done by deconstructing the material gathered into components of text, that can then be categorised as single units; when done, the coding allows the extent of the evidence in different categories to be assessed and themes to be developed that represent the output from the analysis. And - hopefully - a basis of the final results to come from the research.
Hence, we have a simple arrangement of ideas (see Figure 3 below):
- Text is de-constructed into components, or "chunks"
- Chunks are allocated to "categories"
- Categories are used to develop "themes" based on significance and patterns
- Themes may also be informed by the occurrence of words
It would be normal to regard words as the atomic or smallest indivisible unit of analysis, but specific applications or interpretations of the technique work in detail with phrases as well as words, and with synonyms and antonyms; some of the commercial analysis software claims to work at truly atomic levels, for example at the level of individual pixels in an image. Here, however, we will avoid all of those complications and atomic details. We are looking for a comprehensible idea that will assist young research students who are just starting work with qualitative content analysis.
One detail, however, is very important. If we are to accommodate the above structuring of ideas into a software tool, we have to pay attention to the design of the data that will serve the analysis process. Applying the rules of data normalisation, we find two many-to-many relationships that must be resolved: a chunk may indicate many categories, and a category will accommodate many chunks; further, a chunk will contain many words, and a word may occur in many chunks. The latter (words in many chunks) we can live with for the moment, but the former needs attention.
Hence, adopting the notations of an entity relationship model, we have:
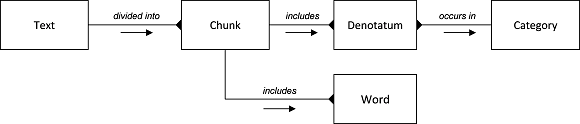
This is a viable data model for the design of a simple database that can contain our research data.
Commercial Tools That Support Research
At this point we can ask how the technology of the modern computer can help us. This is not the place to go into a detailed discussion of the available tools, but it might be useful at least to summarise two commercial examples (as they are promoted by their owners) and to provide links to the web sites that support them:
- NVivo 10 is the latest version of Nvivo, and it comprises "software that supports qualitative and mixed methods research. It lets you collect, organize and analyze content from interviews, focus group discussions, surveys, audio - and now in NVivo 10 - social media and web pages. With NVivo you can deeply analyze your data using powerful search, query and visualization tools. Uncover subtle connections, add your insights and ideas as you work, rigorously justify findings, and effortlessly share your work." (QSR International, 2012)
- The web site for NVivo is to be found at: http://www.qsrinternational.com ATLAS.ti has very similar capabilities, and for Version 7 they "have carefully reviewed every single aspect of previous incarnations of ATLAS.ti and, in close consultation with our users, have added new features and made changes and improvements to existing ones. While the basic operations of ATLAS.ti (segmenting, coding, memoing, etc.) remain the same, there are numerous areas in which users will be delighted to find significant changes. They make working with the program even smoother, easier, faster, safer, and more productive than ever before. All work flows have been examined and streamlined, powerful--and in some cases, radically innovative--new features added, and the overall experience significantly improved." (ATLAS.ti Scientific Software Development, 2012) The web site has an extensive tabulation of features: http://www.atlasti.com
Both web sites provide comprehensive lists of the features, and (with some digging) copious detail about how the products work. Some of the features might be seen as nugatory, for example: why include transcription features when there is very capable free-to-download software that does the same thing? The answer of course is that it is a matter of convenience. And if someone else is paying, why should the young researcher worry? Other features are potentially extremely useful, for example inter-coder reliability testing, but on close inspection that also is achieved by linking to an open facility on an academic web site.
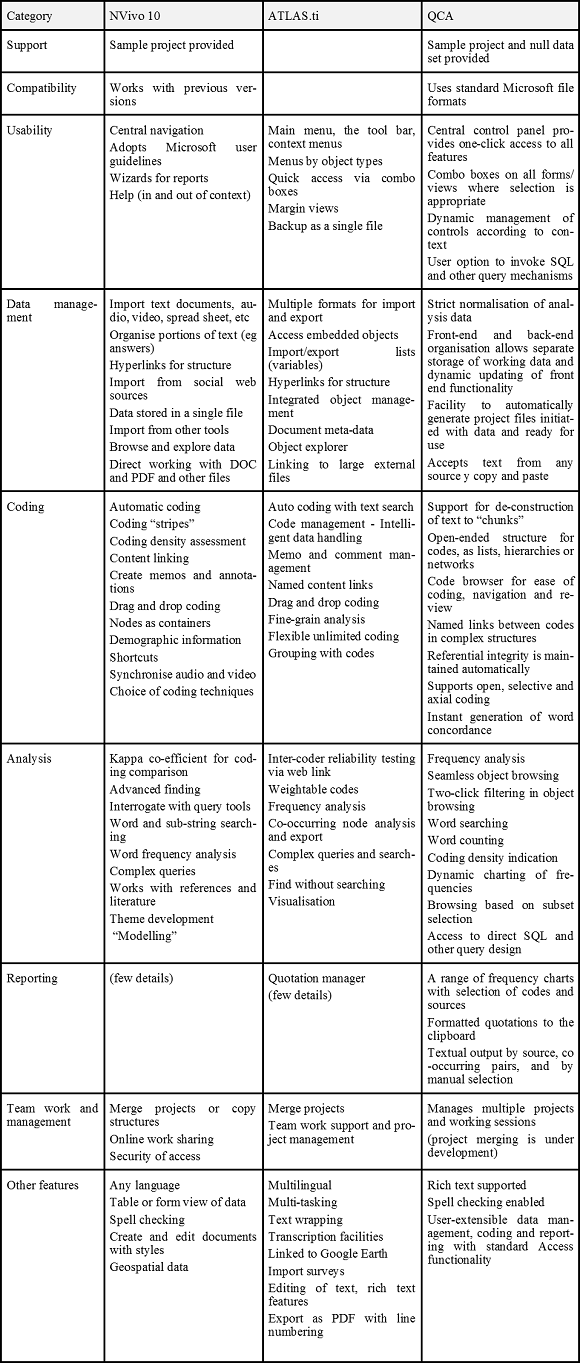
In order to indicate the scope and capability of these two software products, there is a table of features at the end of this paper; the table also includes the equivalent features of the analyser that is the subject of this report, but before going there it is worth looking at the requirements of such a tool in a little more detail.
Requirements of a Qualitative Content Analysis Tool
What are the requirements of a tool for qualitative content analysis? From a utilitarian perspective, and in the light of some experience, we can identify requirements such as the following:
- Compatibility: First, notwithstanding all the other things we think we need, we quickly learn that compatibility with other tools is critical. There is no value in a tool that produces charts that cannot be imported into your document preparation system; no one wants to invest valuable time loading data into a system from which it will never be recoverable. We need to move this stuff around and preserve it for the future.
- Usability: Closely behind compatibility are issues of usability. At least one tool (that will remain nameless here) is available for free download that has no user instructions, no help system, and no clear structure for navigation. We have all become used to very high levels of usability, and we tend to judge everything against our well-loved examples of the best. When we have our research fundamentals to worry about, we do not want to be struggling with systems that are difficult to use.
- Data management: We are dealing with high volumes of data, usually but not exclusively textual, that we have garnered at high cost. It is important that it is handled in an elegant way that maximises the benefits that we can derive from its availability in an analysis tool. It can be argued that data design in situations like this is critical. Without proper normalisation of data structures (for example), someone working with spread sheet software would quickly find it difficult to adapt their data to a variety of analytical needs, and to produce the elegant summary reports that support one's published research.
- Coding and Analysis: Here we need the tool to accommodate the best principles of good qualitative content analysis, so that our limited skills can be amplified and guided by a helpful coding and analysis environment. Support for rapidly changing patterns of coding and categorisation, dynamic charting of frequencies, and succinct summary reports that help us to know how far we have got.
- Reporting: At the end of the day, this is all directed to the production of insightful, reliable and understandable research outputs that comprise the foundation stones or building blocks of published work. Here, we are principally looking for the means to select and include quotations from sources in order to support our arguments, and for some statistical overview of the frequency and density of the categorisation that we have achieved.
- Team work and management: Increasingly, we find ourselves working in partnership with others, all around the world, and the more we can aggregate and share our research data (within the limits of ethical research data management) the better will be our collective understanding of the world we live in.
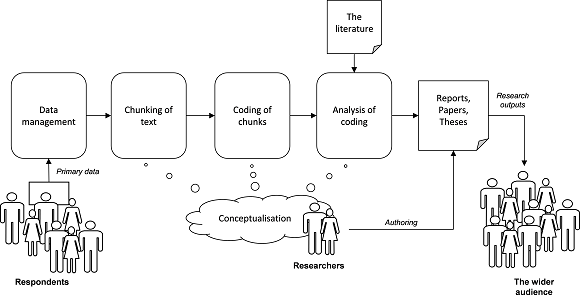
The process of research can be seen as a chain of activities that make clearer where a tool like this might be applied. Perhaps in the event it is rarely this simple, and the figure shows only a part of the whole process (the later stages), but it reveals key stages at which different features of an analyser can help:
Implementation of The Data Structure
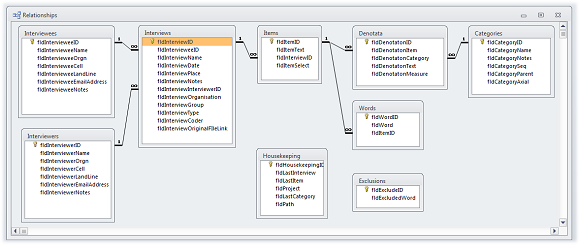
This view of the process needs to be accompanied by a view of the data structures that support it. As indicated earlier in Figure 4, there are at least five tables of data required:
- Interviews: the key data about who was interviewed, when and where, and the complete content of the interview transcript.
- Chunks: the portions of the transcript that represent singular elements or components of the conversation (or narrative) that will probably be candidate quotations for use in written work.
- Denotata: the abstract ideas that links a chunk to a category.
- Categories: the categories that represent the typology into which we wish to locate the results of our analysis.
- Words: the actual words that were used, indexed across a project to show what was said by whom.
In the event, four additional tables were introduced:
- Interviewees: the persons responding to requests for interviews.
- Interviewers: the people doing the interviews.
- Exclusions: common words that have no significance to the research
- Housekeeping: some operational data needed for continuity of working
The figure that follows shows the data structure and relationships that were implemented in the analyser.
Implementation of the Functionality
Data management is achieved by means of Microsoft Access (in its 2010 version), using "forms" for control, data entry, deconstruction, analysis and reporting. A single Control Panel provides access to all functionality:
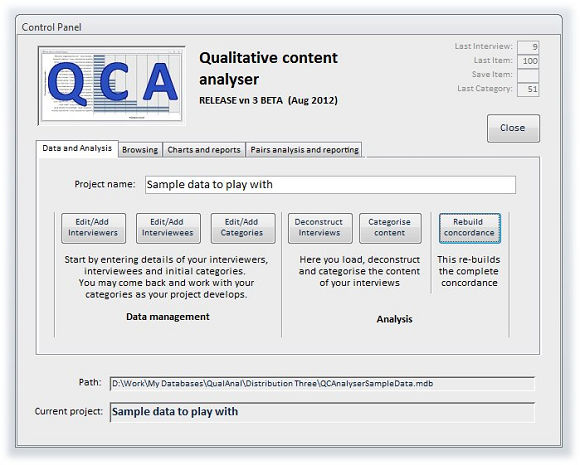
The working forms for data management are too numerous to illustrate here, there is a full set available for review at the web site that supports the analyser. However, as shown by the tabs in the Control Panel there are forms for:
- The creation and editing of basic data about interviews, interviewees and interviewers.
- The creation of chunks of text from the full interview text ("deconstruction") and for the categorisation of the ideas evident within the content of those chunks.
- The construction of a complete word index so that occurrences of words within chunks can be easily found.
And that is just on the first tab. Behind that there are facilities to browse around the data, produce reports and charts, and undertake the analysis of co-occurring pairs.
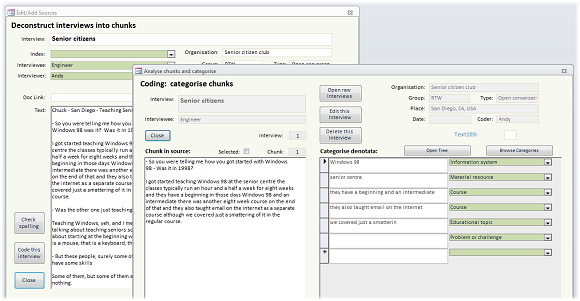
Working with the interview text is achieved using two forms that deal with deconstruction (behind) and categorisation (in the foreground):
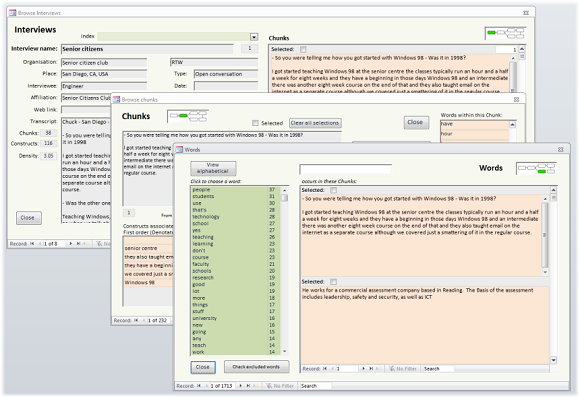
Once the categorisation is complete, it is possible to browse endlessly around the data. Here the forms are colour coded: green areas indicate to make a choice, and the pink areas allow direct transfer to alternative related views of the data:
Perhaps more interesting is to show some of the outputs that are available for reporting purposes. Outputs fall into two categories: charts that show the frequency of occurrence of categories, and textual output for use in written reports, papers and theses. The charts and tables are all based on standard Microsoft Access charting facilities, and they can therefore all be manipulated by a user who is confident to change chart types, edit the properties of data series and axes, and so on.
First, consider a simple chart of the frequency of occurrence of all categories within the interviews. The data that has been used here is from eight conversations with educators around the world (from which the earlier example was taken), and it charts all categories:
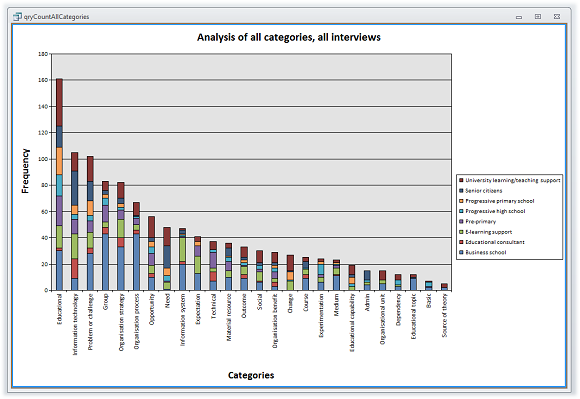
It is very easy to select just the categories that are of interest at a particular point in an argument (in a paper, or in a thesis), and just the interviews that are of interest; it is also possible to apply filters based on the demographic data and according to the group or type of interview that is the focus of a discussion.
A case in point is when one wishes to analyse frequently occurring pairs of categories, occurring together in a single chunk on repeated occasions. This is somewhat akin to factor analysis in inferential statistics, where with recurring patterns the answers to questions are identified and given meaning. In qualitative analysis the discipline is not so tight (it all depends on the subjective decision of the coder when deciding what comprises a reliable "chunk", and which are the appropriate categories), but the results are immediate and can be very useful. In the eight conversations with educators from which the illustrative sample data is taken, the following analysis of co-occurring pairs resulted:
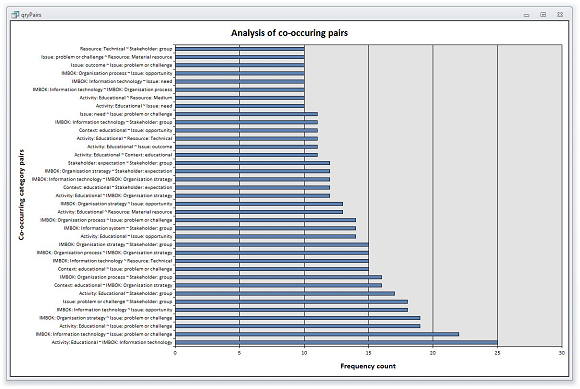
It is here that we can make the transition from simple frequency counting to narrative and discussion. What we see in the above chart is that educational activities were frequently referred to in conjunction with information technology; almost equally, technology was frequently associated with problems and challenges. For many readers this might sound like a familiar outcome, but with analytical data such as this at hand, a narrative about the research results can be identified, structured, and supported with real evidence by the extraction of related chunks, as quotations, as we have already seen in this paper:
The commercial tools talk about the user creating "memos", and perhaps it is at this point that the reader who knows them would be expecting to see how the analyser contributes to the construction of portions of a paper or a thesis, in order to develop the "themes" that are so often the final product of a qualitative analysis. In fact it does not go that far, but it does provide for the selection and output of portions of the text, based on an arbitrary selection of chunks by the researcher whilst browsing the data, or based on the selection of chunks that relate to frequently occurring pairs of categories. These selected quotations can be exported en bloc, to the Windows clipboard, so that they can then be pasted into the written work in Microsoft Word or in any other facility that needs them. We shall see a few such extractions in the final paragraphs that follow here: the analyser has been used in a short survey of its users in order to draw conclusions about its utility and the way forwards.
But now, it is necessary to report on the implementation and early experiences with the analyser.
Implementation of the QCA Package
As indicated at the start, the initial impetus for this project came from the difficulty in affording and accessing commercial software products that would do this kind of work on large volumes of qualitative research data. At the start the initiative was tentative and there was no firm intention to develop and deliver a package that could be distributed widely. However, interest in the package developed quite quickly and despite the formative nature of the program code and the functionality, the analyser served to assist five or six research students through their data analysis. These early experiences were quite positive:
QCA was a very simple tool to use allowing playing around with data and an important range of possibilities in accordance with my knowledge of databases and query language: it was giving me flexibility and helped me to gain a lot of time when I was analysing my data. [Researcher Two, Masters Project, Cape Town, 2012/09/10]
Already we see from this comment that embodying the research data in an open environment (open from the user's point of view) like Microsoft Access had advantages: the data was available, it could be manipulated quite easily using raw SQL, and it was a simple thing to export data into Excel (where some researchers are much more comfortable working).
However, this was not an indulgent exercise in "free time", the researchers involved were under pressure:
I wanted to be using it for the specific purpose I needed it for. That was one main reason why I was seduced by its simplicity. As a matter of fact I was already used to utilising other software for various needs and learning numerous new features was not going to help me there. Clearly I was thinking: don't give me something that does a million things I am not looking for; I wanted to do something and it was able to help me there, and that was it. [Researcher Two, Masters Project, Cape Town, 2012/09/10]
Here there was a need, and the need was served by the availability of a regime with which to organise, store, analyse and report the data. Sophistication and complexity was the last thing needed. The functionality of the analyser was found to be useful, particularly when familiar with Access and its capabilities:
In the beginning, I had an impression that it was complex and not easy to use. This was due to the fact that I know I am not good at MS Access. I was scared to touch things around and navigate with the fear that I could mess everything up. With time … that fear went away and I started playing with its navigation tabs, right hand click option, and the menu ribbon. Now, I am confident with it. I found useful all the features [of the analyser] that I used. [Researcher One, Masters, Cape Town, 2012/09/05]
It is somehow user friendly: it is something I have seemingly seen somewhere. I think that it is easier if consideration is given to the extent of the presence of Microsoft systems in personal computing. But since there are increasingly users of other systems including Open Office, Star office or Mac stuff, in addition to the equally increasing use of web platforms (whether through Google or Microsoft), I would foresee a divide [requiring some kind of] bridging to reach Linux, Mac OS, and online platforms fans. [But] something free … will give a more opportunities to those who just can't afford mesmerising commercial packages. [Researcher Two, Masters Project, Cape Town, 2012/09/10]
Having the availability of a package also stimulated thinking about research and the capability to do it effectively and efficiently:
I principally used the QCA for my analysis of data involving a sort of analysis design (was I going to use themes or just categories or will it be just flat hermeneutics?), the implementation of the design (the analysis itself), and the reporting of findings (interpretations and insertions). QCA followed the technic that I used and borrowed from various authors and helped to speed up the process. I first had to read the whole transcript to get a general idea; then I would select a bunch of text I will comment upon, and eventually create categories; I would then do that for all the interviews; from the categories I would develop a higher level narrative with main categories and eventually themes. [Researcher Two, Masters Project, Cape Town, 2012/09/10]
And so we can conclude that the availability of this analyser has added something to the work of these young researchers, and assisted them to understand how qualitative content analysis works. Both those quoted here had a shaky background in terms of how this kind of research works, and both had difficulty learning from the available texts:
The reality on the ground is that, I almost knew nothing about qualitative research. As I said, research books are so eloquent to explain quantitative approaches of research but there is no clear or easy to understand guidance on qualitative approaches, [despite it being widely said] that interviews and case studies are qualitative by nature. I can say that the training on qualitative research is not as adequate as on quantitative research. Since the beginning, I believed that [qualitative research] was relevant, but I was not sure how, because I did not clearly understand what it involves. Now, I think qualitative research is better than quantitative due to its ability to uncover reality. [Researcher One, Masters, Cape Town, 2012/09/05]
Those involved in the early experience are left optimistic and encourage the project to move on:
I think marketing it to institutions of higher learning would be a good idea. I understand that these are the people who are mostly involved in research. As I am going [home] to Rwanda, I will spread its awareness there. I think it has a potential to be widely used. [Researcher One, Masters, Cape Town, 2012/09/05]
CONCLUSION: STATUS OF THE PROJECT
At the time of writing, the third major release of the analyser was under testing. The objectives of the project were to assist young African researchers who needed assistance with qualitative content analysis and this has been demonstrated. The tentative idea that there is merit in this approach has crystallised and encourages further development.
In order to conclude this report of what is really a work in progress, the six areas of functionality were identified earlier provide a means to summarise what has been achieved:
- Compatibility: From the start, one of the researchers with appropriate experience was able to organise and export the data to other tools, and to apply raw SQL queries of his own design. Compatibility is not a problem, and the strict normalisation of the data has proven to be a good and useful foundation for dealing with the data on a wider basis than within the analyser.
- Usability: There are several levels at which usability needs to be judged: at one level some basic understanding of how Microsoft Office works is needed. Although it is possible to remove the standard Office facilities programmatically, the office "ribbon" sits there at the top of the screen and invites the user's attention. Occasionally, these facilities are useful (for example to refresh all records when processing is interrupted) and it is especially helpful to open the raw data tables and to have the confidence to work with them directly. This is not quite the same situation as if we were building a double-entry book keeping system. But at another level the user needs to be protected from minor glitches in the operation of the program code, for example when Null Values come in variables that can not accommodate them, and more work needs to be done to avoid the irritating messages that come from within the analyser, even if all that is necessary is to press the "Escape" key to bring things under control.
- Data management: Microsoft Access proved to be a reliable tool with which to manage the data, and the situation for researchers who might otherwise fall into the trap of un-managing their data has improved markedly. As any researcher knows, gaining access for interviews can be tortuous, transcribing the conversation takes up to eight times longer than the interview itself, and with such an investment in time and energy it is very important to have the qualitative data in a place (and in an schema) that maximises the possibility to get good results from it. When all the torture of collection and transcription is done, we want to be sure that no barriers remain in working with the data. There were other unexpected benefits, for example with data quality. The analyser in its early form was very simple, and it came to mind to add in a spelling check facility. At first sight this seemed beyond possibility, but on investigation it was possible with just one very simple additional line of Visual Basic code, and in use it is of course, the same spelling checker that we are all used to in Microsoft Word.
- Coding and Analysis: The speed with which coding and analysis can proceed is heartening. It really is possible to throw up a chart, look at the results, and modify parameters so as to bring the focus to the evidence that makes the argument. We are warned in the literature that qualitative content analysis is an iterative process, and that is proven by the early experience. A key need of the researcher is to have the ability to rapidly change coding structures, and to adapt the hierarchy of higher and lower level codes so as to bring elegance and persuasion to the discussion and analysis of results. Ideas for improving the means to do this continue to come to light, and will be implemented.
- Reporting: Here a simple approach has paid off. Although the early users were not aware of it (and requested facilities to automatically print off outputs) any chart, table or text within the analyser can easily be printed with no special facilities, and in the end the clipboard is the author's best friend. Even the charts (such as those reproduced here) are very easily grabbed from the screen, pasted into an image editor, and moments later are cropped and pasted in the finished document. Experience suggests that there is no strong need for more sophisticated reporting facilities provided that users are happy to work the details themselves inside their document preparation software.
- Team work and management: At the very start of this initiative it was clear that there would be a need to work as a team, because in the largest research project several different people had undertaken the interviews, the burden of transcription had been shared with others, and the coding (still in progress at the time of writing) is also shared between team members. Hence, there are different pools of data in the care of different researchers, and it all has to be brought together. Microsoft Access is not in any sense a web-based regime for data management (although data can be uploaded to the web, it is just that functionality outside of Windows is very limited) and in an application like this problems of sharing are compounded by the need to manage unique keys (in the data tables) in a way that avoids duplication across different operators, undertaking different coding on different source texts. An early attempt to deal with this by the use of randomised keys (one feature of Access) was only partly successful, and therefore it was necessary to code a rather tortuous utility that is able to merge categorised research data and bring many sources into one place. However, this is really only a work-around, and more effort will be required if the QCA package is to be improved for team working. More than just merging the data is needed in a team-working situation.
Nevertheless, the intention of this initiative was not to be clever, or complex, but to provide a relatively simple (and completely cost-free) solution for researchers working with qualitative data for the first time. In that, it seems to have succeeded.
REFERENCES
Appendix: A tabular comparison of features