Augmented Reality at the Service of Participatory Urban Planning and Community Informatics - a case study from Vienna
- Researcher, Institute of Landscape Planning, University of Natural Resources and Life Sciences, Vienna, Austria. E-Mail: florian.reinwald@boku.ac.at
- Researcher & Director, Verkehrplus GmbH, Austria.
- Researcher, Department Social Work, University of Applied Science, Vienna, Austria.
- Transport Planner & Sociologist, Verkehrplus GmbH, Austria.
- Assistant Professor, Institute of Landscape Planning, University of Natural Resources and Life Sciences, Vienna, Austria.
Augmented reality is a new way of "seeing". One's own perception - mostly visual - is enhanced through computer-generated information. This can be achieved in a variety of ways - see-through devices, head-mounted displays, mobile devices (cf. amongst others, (Wietzl, 2007; Höhl, 2007). The common features of all these systems is that virtual reality and reality are combined and overlaid, the systems operate interactively in real time and three-dimensional information is provided (Azuma, 1997; Azuma et al., 2001).
This paper is based on the results of an applied research project: "ways2gether - target group-specific use of AR and web 2.0 in participative traffic planning processes". It reports on the qualitative and quantitative results of a field study of augmented reality technology applied to two urban planning projects, in particular the development and field test evaluation of an augmented reality app. When investigating the impact of augmented reality applications in the participation process five main questions were addressed: (1) How important is participation in urban planning projects for people? (2) Which groups can be targeted with AR instruments? (3) How do different groups assess the use of AR in participation processes? (4) How much can AR increase knowledge regarding a project? (5) What are the advantages and disadvantages of using mobile AR applications, compared with paper-based visualization?
In addition to providing a brief explanation of augmented reality in urban planning and participation procedures, this paper makes a contribution to augmented reality applications as planning support systems that adopt experimental or quasi-experimental designs in order to investigate the usefulness of these new technologies and participation techniques outside the laboratory.
FROM REALITY TO AUGMENTED REALITY (AR)
Initial research on virtual reality and augmented reality dates back to the 1950s (Carmignani et al., 2011). However, the first definition of augmented reality was provided in 1997 by Azuma: An AR environment has the following three characteristics: "1) Combines real and virtual environments, 2) Is interactive in real-time 3) Is registered in 3-D" (Azuma, 1997, 356). While augmented reality has been in use since the 1990s, this has mainly been in research projects, and only a few specific projects have been developed. The first experiences with AR that are of interest for end users, were developed for marketing purposes (Höhl, 2007; Heldal, 2007). However, for these webcams were used which were connected to personal computers. There are two common ways to provide location-based information: using a GPS module or, alternatively, using so-called marker-based technologies. The first approach uses a GPS receiver to provide the actual position. The second approach is to use QR Codes, so called LLA Markers (latitude/longitude/altitude detection).
Only in recent years have mobile AR applications enjoyed an increased presence due to the development and use of AR browsers (e.g. Wikitude since 2008, Layar and Junaio since 2009). The applications are already widespread and are showing dynamic development. Due to the current distribution of suitable mobile devices equipped with cameras, data connection and improved computing power, augmented reality applications have become of interest to the end user.
At present, this new technology is mainly used for marketing, navigation, in the game sector, in medicine, as well as for service technicians and in tourism.
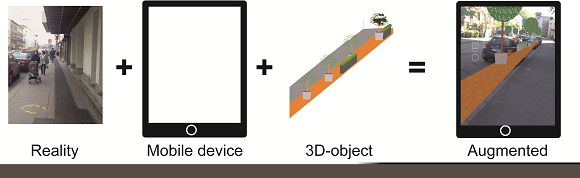
To illustrate augmented reality on mobile devices, different components are required: reality, the built environment, a mobile device with a camera, a three-dimensional plan, and software that can overlay these elements (see Figure 1).
Augmented reality and (urban) planning
The planning sector is increasingly interested in AR technology. The assumption is that the use of AR can support quality assurance in planning processes (Nash, 2010). In particular, architecture and urban and landscape planning could benefit from the use of AR applications. In all these disciplines we usually have to work within a given spatial framework and there are no options for "laboratory experiments" (Vollweiler & Jung, 2011, 86). Reality itself is the framework for planning and design. The use of augmented reality can make a decisive contribution to examining intended and unintended effects in advance.
Augmented reality in planning is a contribution to the toolsets used to visualize plans and projects. Al-Kodmany (2002) developed a conceptual model to organize the manifold toolset for visualizations in planning. According to his model, non-computerized tools can be divided into (1) pen and paper, (2) paper maps, (3) photographs and (4) 3D physical models. The corresponding computerized tools are (1) electronic pen and paper, (2) GIS, computer-aided mapping (CAM), mapping information management systems (MIMS), (3) image editing programs, motion picture, video and (4) 3D digital models, virtual reality, and urban simulators (Al-Kodmany, 2002, 190). Augmented reality tools fit best into the fourth category. They are more likely to be comparable and intersect with 3D digital models and virtual reality (VR). Milgram et al. (1994) also agree that AR and VR are related. They describe a reality-virtuality continuum, calling it mixed reality (Milgram et al., 1994). Mixed reality combines elements of the real AND virtual environments. AR is, according to their concept, closer to the real environment because virtual elements are presented taking the real world as a basis.
Within the AR sector, different methods are used to combine reality and vitality. Höhl in 2008 differentiated between four different possibilities: projective augmented reality, video see-through, optical see-through and monitor-augmented reality (Höhl in Broschart, 2013). Another distinction can be made between stationary and mobile systems. The ways2gether project focuses on mobile-monitor-based augmented reality.
Currently, the majority of AR applications are used to provide location-based information. The approaches which use mobile augmented reality in planning can be separated into three categories according to the hardware used, the way they determine actual position and which information is provided. The first classification is made based on the mobile devices used: examples such as the "Archeoguide" (augmented-reality-based cultural heritage on-site guide), which shows multimedia information such as historical buildings, need special mobile devices (Vlahakis et al., 2002). Another approach is to use common mobile equipment such as smart phones or tablet computers.
These approaches can also be distinguished in terms of the way the location position of the mobile device is determined. One option is to use GPS, the other is to use LLA markers. An example is "Smart Walk", in Saarbrücke, a virtual tour through different stations to view the project "Stadtmitte am Fluss" (New city centre close to the river). Different visualizations such as a new bridge, as well as information such as noise distribution or flooding simulations are provided by using QR Codes to determine position (Broschart et al, 2013). Another example of these tools is produced by Ovos, who developed their own app for the Seestadt Aspern (brownfield development project in the City of Vienna), in order to view the Master Plan on mobile devices (www.ovos.at.). The future city can be viewed from five different viewpoints which are defined by LLA markers. However, you are fixed to the point where the LLA marker is set and are unable to move freely within the model.
AR systems can also be differentiated according to the type of visual information provided. The most popular AR browsers such as Layar, Wikitude or Junaio work on regular mobile devices but most of the time only location-based information such as restaurant signs, offices or other points of interest such as museums are displayed. The real-estate sector also uses these instruments for real-estate searches, information on the surrounding area as well as for interior design or marketing (Lang & Sittler, 2013). The last category includes AR systems which use common mobile devices such as smartphones or tablet computers and provide three-dimensional information. Mostly they use tailored apps on regular mobile devices. The ways2gether project focuses on AR tools within this category, with the aim of using common mobile devices such as smartphones or tablet computers in order to reach a broader public. We also want to make it possible to move freely within the AR model, and so we have chosen to work with the GPS signal.
Augmented reality in participation procedures
Augmented reality has the potential to expand the range of instruments which are offered to support (e)Participation. It is expected that computerized tools like AR will change but also increase the quality of participation (Al-Komandy, 2002).
The OECD distinguishes three levels of government-citizen relationships in participation and policymaking: The first level is "information" - a one-way relationship. Information is produced, provided and spread by the responsible authority. The second level is "consultation". A two-way relationship is offered, so that citizens can provide feedback. The third and highest level of participation is "active participation". Another requirement is that government and citizens are actively (and equally) engaged in policymaking processes. The OECD therefore regards new information and communication technologies (ICTs) as a powerful tool which could bring administration and citizens "online" and increase the quality of participation (OECD, 2001).
Fung (2006) identifies six modes of communication and decision making. He differentiates between three modes of communication: providing information (participants are spectators who receive information), participants expressing their preferences (participants ask questions or express their opinion) or discussions where participants learn more about the project from each other and transform their view (Fung, 2006). His distinctions, relating to the decision-making process, are: "aggregation and bargaining", which means that the participants discuss the different points of view based on their own preferences and "deliberation and negotiation" where participants are first informed about different perspectives and, based on this, identify and deliberate on the options. The third approach is to use the "technical expertise" of experts to solve decision-making problems without the participation of citizens (ibid.). AR tools first and foremost provide detailed information and thus lead to a better understanding of the requirements and necessities of a planned project. This enables them to increase knowledge of the project impact by means of spatial visualizations.
Senbel and Church (2011) see visualizations in planning, especially the digital technologies developed over recent years, as a "mediator of empowerment" in participation, and compared these instruments with others such as physical models or films. The result is that each instrument has been found to have a particular strength in empowering people. A combination is needed and the visualization media "have to be embedded in a much larger process of mutual trust-building" (Senbel & Church, 2011, 11). AR on its own does not necessarily enhance the quality of participation. The whole process of participation has to be taken into account and a balanced set of tools is needed. Additionally, instruments and other tools are necessary to give the people, for example, the possibility of putting forward their own ideas or discussing the proposed plan with one another. Therefore, when developing the app and its use in participation processes, it is necessary to combine the use of the AR tool with other ICT tools and "traditional" instruments.
Augmented reality (in combination with other ICT tools) in urban planning and participation processes has the potential to improve these processes and make them more efficient (Nash 2010). To increase the standards and quality of participation procedures, AR instruments should satisfy requirements such as "framework conditions and contents should be clearly and comprehensively communicated" or "equal chances for different groups to participate and influence the decision-making processes should be guaranteed" (Bundeskanzleramt Österreich, 2008). New presentation, mediation and visualization methods which can be understood by all the parties involved in the planning processes, and which can be applied independently and sustainably, will improve the standards of public participation (Siegler & Wietzl, 2009).
One assumption underlying the development of the app is that the use of augmented reality not only makes it easier for laypersons to understand planned projects but also helps to reach new groups for participation. People not only need willingness but also time to take part in participation procedures. As we know from gender and diversity research in planning and participation, this strongly depends on the life phase and life situation of the citizens (Damyanovic, 2013). Aspects such as care obligations, physical disabilities, language barriers or the amount of spare time have to be taken into account. Inequalities in decision-making processes often result from a lack of participation of certain groups. Consequently all the different views on a planned project are not incorporated comprehensively. Therefore the AR app was also evaluated in regards to its potential to promote inclusive planning processes.
Another aspect of the development of the app was the aim to use it in different planning and participation processes. Therefore different processes were analysed in order to point out different options and possibilities for using AR (Reinwald et al., 2012). In short, the analysis showed a broad spectrum of possible situations in which AR can be implemented. In detail, links and applications for AR instruments have been identified at almost all levels and stages of a planning and participation process; these can be used in different phases and in line with the objectives of a participation procedure. The following have been identified as central points of contact for the implementation of AR tools in participation processes in planning: (1) individual (online) information (and consultation) - using additional online/offline tools), (2) on-site information, (3) analysis of the planning area, (4) inspections and on-site meetings, (5) participation in the development of the design, (6) visualization of drafts, and (7) visualization of the final result (Reinwald et al., 2012). For the ways2gether project, we mainly focused on the augmented visualization of drafts and final designs.
DEVELOPING THE WAYS2GETHER APP
The ways2gether app was developed as part of the "ways2gether - target group-specific use of augmented reality and web 2.0 in participative traffic planning processes" project (duration 2011 - 2013). The basic idea of the project was that by using AR it is possible to make planned changes visible and reduce barriers caused by a lack of three-dimensional imaging. We also expect that new target groups, for example teenagers who are rarely interested in participation processes, or people with little time to take part in participation processes due to care obligations, can be reached with these instruments (Jauschneg & Stoik, 2012).
In order to develop the app, in addition to the aforementioned analysis of possible implementations, an ex-ante analysis of the requirements regarding usability, immersion, accuracy of position, etc. was conducted by means of expert interviews and literature research (Jauschneg & Stoik, 2012). The main result of the expert interviews was that the effort required for implementation in participation processes, operation and maintenance must be low for the process facilitators, planners and the people who take part in the participation procedures. For the planners it is important to consider the workflow within a planning or participation process and ensure that it is possible to use common data interfaces and software for the development of the 3-dimensional model.
To ensure the efficient use of AR in planning and participation processes, the extra expenditure and necessary technical skills for planners must be kept as low as possible. The AR framework of the ways2gether app is therefore based on the Metaio Mobile SDK by Metaio GmbH (http://www.junaio.com), which includes a 3D rendering engine that can be integrated into apps. The ways2gether app (see Figure 3) runs in an iOS environment on iPhones and iPads, and is available through the Apple App Store. When developing the 3-dimensional models we decided to use "Google Sketchup Pro" because it is easy to handle even for those who do not have professional 3D modelling skills, and because it can export the 3D models in OBJ format for the Metaio Mobile SDK. The program can also import models using the DXF and DWG format, which is used by common CAD software such as AutoCAD. This makes it easier to integrate existing models in the AR framework and the software is freely available and easy to handle.
The capabilities of the AR browser also have to be taken into account during the development of the app. Only a restricted number of faces (surfaces) is possible, so the models have to be of reduced complexity to run smoothly on mobile devices (for the exact description of the workflow and the requirements see Reinwald et al., 2013).
A number of technical challenges are presented, especially in relation to GPS accuracy, partially developed software products as well as limitations in the processing power and visualization possibilities (graphics performance) of the mobile devices. The current restrictions on the use of mobile AR instruments, such as processor speed, screen size and resolution, and low battery life, are increasingly not an issue. We have chosen powerful mobile devices (the ways2gether app was developed and tested with iPhone4S and iPad2/3) that can handle the necessary visualization requirements and, especially the iPad, have a big screen which is important if the app is to be used for guided on-site inspections.
The speed and accuracy of GPS systems still presents key challenges, as deviations of up to 7-8 m are possible. When developing the app we also experimented with LLA markers to increase the accuracy of the location determination. But on initial examination it became clear that by using LLA markers it is not possible to move freely within the model, as the position is fixed. But this free movement is a central feature of the AR app so we decided to develop a workaround. The app regularly uses the GPS signal but it is also possible to choose a mode in which the orientation of the model and the position in all spatial axes can be adjusted manually. This enables the model to fit better into the surrounding area. The disadvantage of this approach is that a strong three-dimensional imagination is required to manipulate the orientation. During the field test the models were calibrated by members of the project team and afterwards the iPad was handed over to the participants.
Components of the ways2gether app
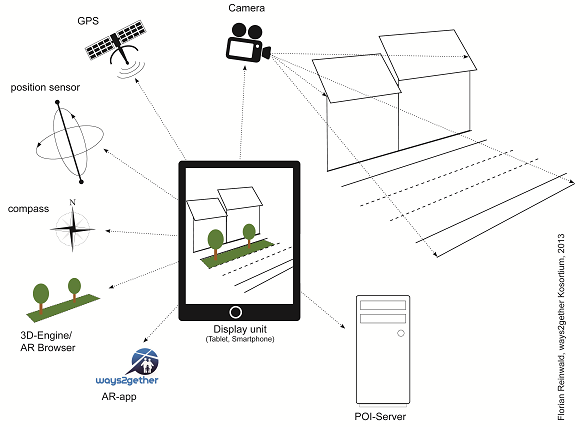
The real situation is recorded using the mobile device's own camera and the exact spatial position and direction of view is determined using a tracker system such as a GPS, position sensor and compass on the mobile device. This information is processed in ways2gether app and a three-dimensional rendering of the model is generated. Using an AR browser (Junaio SDK), the 3D rendering is shown on the display, together with the camera image (see Figure 2).
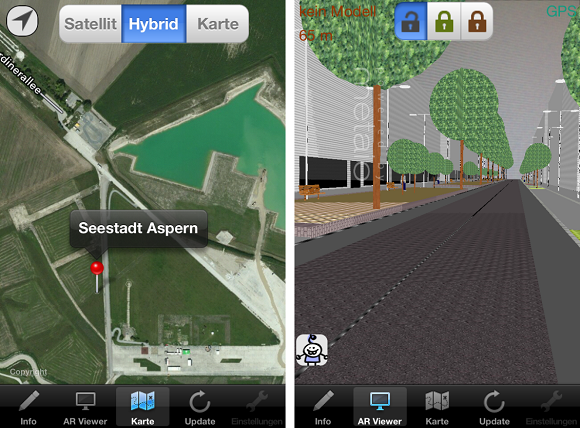
The app itself contains two main sections: first, there is the "map mode", in which you can see on a map your actual position and the points of interest (POI) around which three-dimensional models are available (Figure 3, left picture). By visiting these POIs the users are able to view planned projects on site. The map also offers the possibility of dragging and dropping a specific POI to the current location, so it is also possible to look at planned projects without visiting the site. The second main feature of the app is the AR viewer (Figure 3, right picture). This part of the app is used to view the 3D model. The position is continuously updated, so you can walk through the entire model to look at the planned project from any viewpoint.
FIELD TESTS USING THE WAYS2GETHER APP
The core objective of the field tests was to test and evaluate the "ways2gether app" under real-world conditions. Two field tests were conducted in different urban areas in the City of Vienna (Austria). Two information and participation settings were therefore developed. The purpose of the analysis - based on the theoretical findings described above - was to examine (1) how important participation is in urban planning, (2) how many participants have experience with public space and street design plans and 3-D visualization, (3) how effectively the different visualization methods increase overall knowledge regarding the project and (4) what are the pros and cons of both visualization methods.
Setting of the field tests
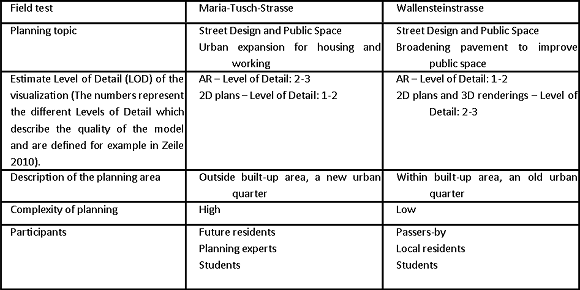
To better compare the results of the field test, two similar examples were chosen - both dealing with public space and street design. One field test was situated in the Wallensteinstrasse, a (local) shopping street in a densely built-up district dating from the period of rapid industrial expansion. The Wallensteinstrasse is a major urban road in the 20th district of the City of Vienna with a tram line and many stores, bars and restaurants on the street level. The second field test took place in the future Maria-Tusch-Strasse situated in an urban development quarter. The Maria-Tusch-Strasse is a road not yet built in a planned new city quarter - Seestadt Aspern (Aspern, Vienna's urban lakeside). When completed in 2028, the future city quarter of "Seestadt Aspern" will accommodate 20,000 inhabitants and provide jobs for 20,000 people. The Maria-Tusch-Strasse connects a residential quarter and what is known as an "innovation quarter" with commercial use, and should also serve as a (local) shopping street for the residents.
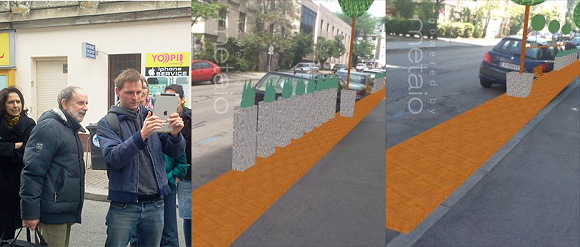
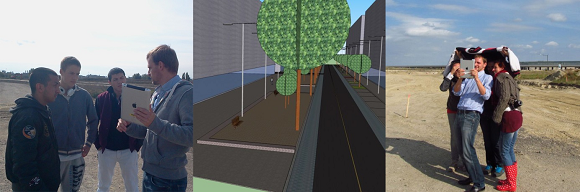
In the Wallensteinstrasse and the Maria-Tusch-Strasse, field tests for the ways2gether app were associated with ongoing participation processes. In the Wallensteinstrasse the "Gebietsbetreuung" (local offices of the administration of the City of Vienna responsible for city renewal) planned a project to improve the quality of the street in summer, especially for pedestrians. At the moment, the pavement is narrow, there are no trees and the provision of outdoor dining areas is prevented by the large number of parking spaces. It is planned that, as a temporary measure during the summer, the pavement would be broadened by wooden platforms in order to gain space for pedestrians. Green areas and sitting space are also envisaged to increase the attractiveness of the street. The "Gebietsbetreuung" keeps residents regularly informed via an information booth installed in a public space, which shows people the planned projects. In this context, the ways2gether app was used to inform the people about the planned changes (see Figure 4).
In the Maria-Tusch-Strasse in Aspern, the field test was integrated into the information and participation process of the "Wien 3420 Aspern Development AG" (Development agency of the City of Vienna and investors for the new city quarter). They regularly organize site visits and participation events to inform future residents and interested parties of the ongoing development process and planned projects. The ways2gether app was tested during a participation event on the development of a new residential area within Seestadt Aspern. Building and street-design plans were presented in an "Info box" and site inspections for future residents and interested parties were organized. The ways2gether app was used during the site inspection (see Figure 5).
The aim was to gain information regarding practical uses of the ways2gether app under various planning and participation conditions. The projects differ in complexity. Different methods of visualization - augmented reality on mobile devices compared to paper-based 3D renderings and/or 2D plans - were also used (see Table 1).
Site inspections
The people taking part in the field tests in the Wallensteinstrasse were mainly passers-by, interested residents invited by the "Gebietsbetreuung" and (first-year) students. In the field test in the Maria-Tusch-Strasse, it was mainly future residents, interested parties and planning experts who took part, as well as (first-year) students.
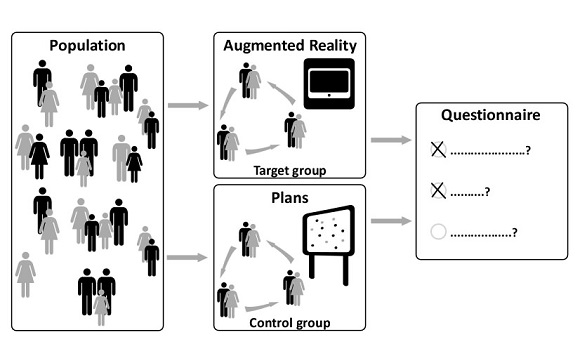
The site inspections always followed the same pattern. Fieldwork was roughly divided into the following phases: (1) The participants were separated into two groups, aiming at similar gender distribution in both groups. One group explored the site with the AR application (target group) and the other group with 3D renderings and/or conventional 2D plans (control group) (see Figure 6). (2) The group was accompanied by two members of the research team - one member informed the participants and the other observed communication and general behaviour among them (= qualitative results). The tour, with on average five participants, took place over a predetermined route and lasted about 15 minutes. To avoid any information asymmetry between the groups, and to ensure similar conditions for each tour, the member of the research team only described the aims of the project (e.g. content and purpose). The inspection paused in several places and the participants had the opportunity to ask questions on the project and the information presented, or to discuss with one another. To create a real participatory situation, no specific information on the two methods of visualization was given to the participants. It was observed whether and how behaviour differed between the two groups. It was also observed whether different age groups behaved differently. The third observed aspect focused on the form of interaction between those taking part and the aspect that most drew their attention (i.e. whether their attention was attracted more by the proposed planning, the form of presentation or the technology). (3) After the site inspection, the participants answered standardized questions regarding demographic details, the general importance of participation in the field of planning public space and street design, and their perception of the visualization method utilized (= quantitative results) (see Figure 6).
Following the field tests, a focus group (Flick, 2004, 165-183) was formed to organize reflexive discussion with the members of the research team accompanying the site inspections. All process facilitators took part, both those conducting inspections with the AR tool and those who used a paper-based form of presentation. The facilitators reflected on the course of the tours, the conduct of the participants, the conduct of various target groups, interactions during the visits and where the participants' attention was focused in each case.
SAMPLE
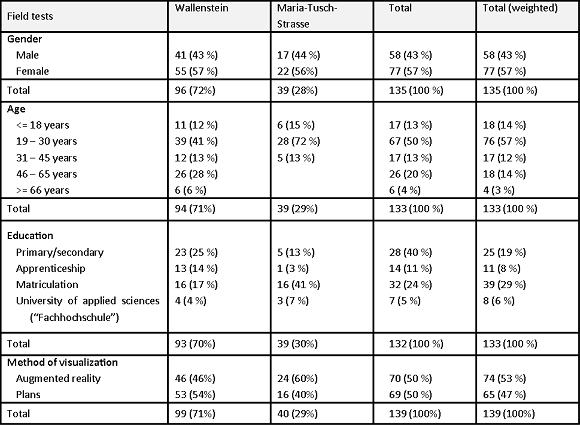
Details of age, gender, level of education and the visualization method that was used are summarized in Table 2. An evaluation of the data reveals that the total sample consists of 139 people. In some ways, the sample is not representative of overall Austrian demographics. The differences are as follows: (1) Women are over-represented in the sample, in both field tests. (2) Younger people are over-represented, particularly in Maria-Tusch-Strasse. (3) People with high levels of education are over-represented in both cases.
EMPIRICAL METHOD
The samples had to be weighted differently due to the different numbers of participants in Maria-Tusch-Strasse and Wallensteinstrasse. The participants in Maria-Tusch-Strasse were given a higher weighting factor (1.74) than the participants in Wallensteinstrasse (0.70) (see Table 2, last row). To compare the differences in the way the two groups evaluated augmented reality compared to paper-based visualization and two-dimensional plans, an experimental design with two groups was applied. One group (identified as the target group) received information through the augmented reality application and the other group (the control group) through conventional plans and visualizations. To evaluate the strengths and weaknesses of the two visualization methods, the mean values of different quality criteria were compared. Each criterion has a response range of 1 to 6 with 1 meaning very positive and 6 meaning very negative. To indicate statistically significant differences between the two groups a t-test with independent samples was used.
QUANTITATIVE RESULTS OF THE FIELD TESTS
The quantitative results of the statistical evaluation were used to analyse: a) Importance of participation, b) Prior experience with visualization methods, c) Knowledge enhancement, d) Comparison of both visualization methods, e) Comparison of augmented reality for different planning contexts.
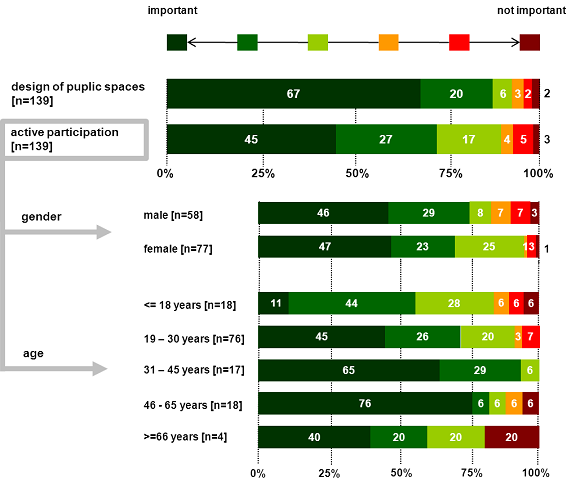
1. Importance of participation
In general, the respondents stated that participatory approaches in the design of public spaces were very important. Being an active part of these participatory processes through two-way communication was also very important for the participants. The results show that active participation, which improves communication with planners and non-planners, is rated high. This is more important for women than for men and is most important amongst middle-aged people and lowest for citizens under the age of 18 and over the age of 65 (see Figure 7).
2. Prior experience with visualization methods
Experience of 3D plans and 3D games was explored through the following questions: (a) How often are you exposed to the use of 3D? (b) Do you play 3D games (e.g. 3D racing games, 3D adventure games, and urban simulations)?
Both questions provided insights into experience with particular visualization methods. The obvious assumption that people with more 3D gaming experience are more engaged with augmented reality could not be statistically confirmed. This probably indicates that games are only one place where people may experience 3D visualizations.
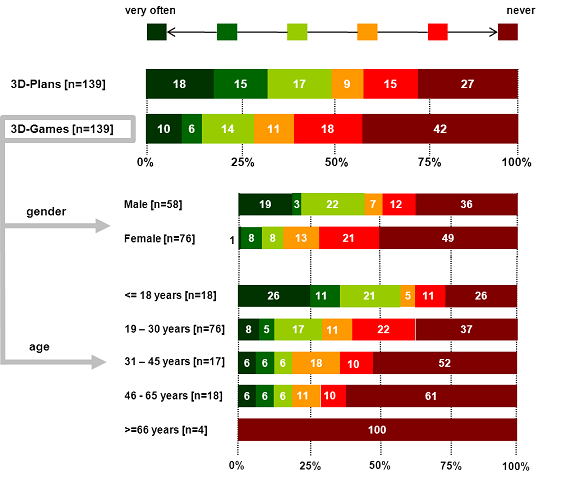
Figure 8 illustrates that about half of the participants have experience with 3D plans and approximately a quarter have experience with 3D games. Men tend to play 3D games more often than women. About half of the women and over one third of men (36%) have never tried 3D games. People over 66 years of age never play 3D games whereas people under 18 are highly over-represented gamers.
3. Knowledge enhancement
The analysis showed that both visualization methods are appropriate for increasing knowledge.
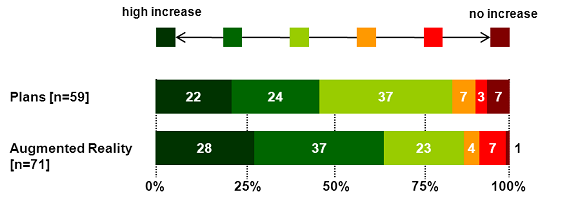
Figure 9 illustrates that most of the participants assert that they have increased their knowledge about the project. Only 17% of the control group (paper and 2D-based plans) and 12% of the target group (augmented reality) stated that their knowledge had not increased considerably. 65% of the target group (AR) and 46% of the members of the control group (paper and 2D-based plans) claimed that they achieved a significant increase in knowledge.
4. Comparison of both visualization methods
To compare how the two groups evaluate augmented reality and plans, the mean values of several criteria were compared. The evaluation criteria featured a response spectrum ranging from 1 to 6, where 1 signified a very positive assessment and 6 signified a very negative one. By using a t-test, statistically significant differences between the criteria of each visualization method were identified and marked with an asterisk in Figure 10 (A significance level of 5% was used).
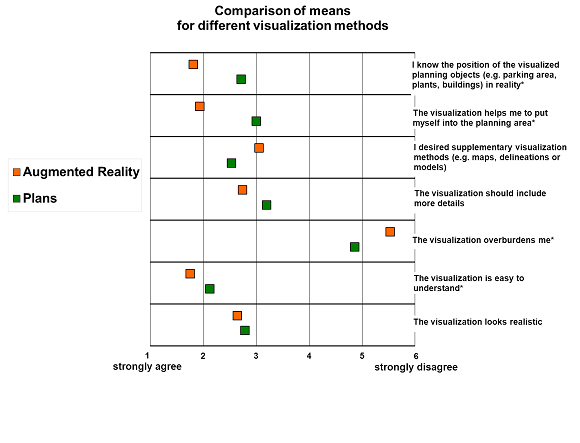
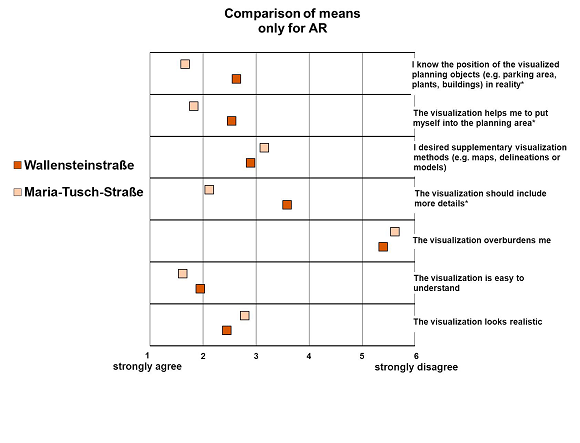
Figure 10 illustrates that both augmented reality and 2D plans and renderings are suitable for participatory processes. The augmented reality application was evaluated more positively than 2D and paper-based plans, with the exception of a desire for supplementary visualization methods (e.g. maps, delineations or models). Using augmented reality makes it easier to identify the position of planning objects (e.g. parking area, plants and buildings) and supports immersive perception.
5. Comparison of augmented reality for different planning contexts
Figure 11 identifies the field tests in which augmented reality was most advantageous. It should be noted that in Maria-Tusch-Strasse the quality of augmented reality (LOD) was higher and the planning project more complex than in Wallensteinstrasse (see Table 1). Augmented reality was evaluated differently in both field tests. For the participants in Maria-Tusch-Strasse, it was easier to position planning objects (e.g. parking area, plants) due to the fact that the visualization was more immersive. Participants in Maria-Tusch-Strasse also had a desire for more details. This desire for more information probably related to the high complexity of this project.
DISCUSSION OF THE ADVANTAGES AND DISADVANTAGES OF THE USE OF AUGMENTED REALITY BASED ON THE RESULTS OF THE FIELD TESTS
In the following sections the results gained during the field test are reflected on and discussed based on the questions posed at the beginning of the paper: (1) Which groups can be targeted with AR instruments? (2) How do different groups assess the use of AR in participation processes?
AR as an instrument that facilitates participation and reaches new groups
A central task of policymakers is to ensure open and inclusive policymaking processes. Citizens should be better informed, public awareness should be raised and participation should be facilitated. The results of the field test show that the participants are highly interested in changes to their spatial environment. In particular, they consider discussing, co-creating and participating in street design and public space to be essential. Independent of the visualization method, the participants responded positively to the fact that they had been informed at all. The results show that the majority of test subjects are eager to participate. Being an active part of the process, utilizing two-way communication, is especially important for test subjects (Figure 7).
The "OECD Guidelines on Open and Inclusive Policy Making" (OECD, 2010) defines principles for policymaking and public participation. One aspect is "inclusion": "All citizens should have equal opportunities and multiple channels to access information, be consulted and participate. Every reasonable effort should be made to engage with as wide a variety of people as possible" (OECD, 2010, 6). The use of ICT tools is seen as an important contribution to increasing awareness and participation (OECD, 2013, 146).
Another international approach also focuses on the empowerment of individuals and communities and the enhancement of community development by using ICT: "Community Informatics (CI) is the application of information and communications technology (ICT) to enable and empower community processes" (Gurstein, 2007, 11) - broad and open definition which allows for the incorporation of the different methods and tools used.
As planning and participation are processes mostly embedded in a concrete social structure or a community it is obvious that they are linked with the community informatics approach. An interesting aspect of this approach is the "holistic understanding of the relationships between planning and technology" (Saad-Sulonen & Horelli, 2010). One aspect discussed within this approach is the "digital divide". People do not have equality of access to digital information and have different capabilities when it comes to using information technology and digital tools. A study by Google shows that 48% of the Austrian population older than 16 have a smartphone (compared to 21% in 2011) and 52% of them search at least once a week for local information (services.google.com/fh/files/misc/omp-2013-at-local.pdf). At first glance this represents a huge group which could be reached by mobile AR instruments - but also a huge group which is excluded. This is not only those who do not have a smartphone but also those who are not able to use complicated apps.
"Access" is mostly discussed within the context of the "digital divide". But according to Gurstein (2003) it is not only the access, it is the way ICT is (practically) used (and developed). He introduced the concept of "Effective Use". Access is just a "precondition" for receiving the benefits of an ICT tool (Gurstein, 2003). That means that when designing a new tool such as augmented reality, individual needs - from the communities involved as well as those relating to the specific setting - also have to be taken into account. Merely providing the augmented reality app is not enough. For the development and testing of the app we decided to embed the use in an accompanied participation process. We designed and tested the app in the framework where it was to be used and in cooperation with experts and the target audience who stood to benefit from the app. We wanted to see how people used it and what ideas they had to make it more effective.
One of our key ideas for the development of the app was that groups who are not included in regular participation procedures - such as children and young people as well as, for example, people with little time due to care obligations - could use this tool to become more informed. Only the use of an age-appropriate language and tools would allow it to include certain target groups like young people in the processes. In both field tests younger people were most interested in AR. Younger people play 3D games more frequently, thereby gaining initial opportunities to experience 3D simulation, especially with augmented reality visualizations (Figure 8).
The field test in the Wallensteinstrasse - a residential area with a high immigrant population - also illustrated that augmented reality applications can help to overcome language barriers, mainly because the model is mostly self-explanatory. So it helps people to get informed and to give feedback, although the language skills of the process facilitators are still crucial. The observations have shown that a key advantage of AR visualizations is that the spatial setting and the planned changes are immediately visible. It is no longer necessary to explain the difference between the already existing environment and the impact of the planned project. People's comprehension is quicker because they are able to focus on the changes and the specific spatial setting as it exists in reality.
AR makes it easier for laypersons to understand planning projects
Laypersons that do not have the knowledge to understand two-dimensional plans or renderings are able to assess future planning in a more effective way through the use of a combination of real-world and augmented reality (Broschart et al., 2013). By overlaying these two information levels, it is easier to understand the environmental context of a planned project. Quantitative results confirm that, in essence, both augmented reality and 2D or 3D plans are adequate visualization methods in participatory processes. They are suitable for informing people, especially at the beginning of the planning process where a lower level of detail (LOD) is sufficient. The majority of participants who used AR argued that their knowledge increased considerably (see Figure 9). Quantitative and qualitative results show that AR is more immersive, does not overburden the participants and makes the plans easier to understand. The AR tool encouraged users to move freely within a space and observe it from different viewpoints. The comparison of the different field tests shows that AR is especially advantageous where planning projects are more complex.
The observations showed that with the AR tool it is possible to discuss measures for change clearly and in more detail than with conventional 2D plans. Also the possibility of manipulating the observers was more difficult within the framework of the application of the AR tool, because the planned project is shown in combination with the real world.
The comparison of the observations also shows that the application of the AR tool encouraged the participants to look at the representation, i.e. whether the planned design element (such as flower troughs, trees) is shown in a way that corresponds to reality. This effect has two consequences. On the one hand, discussing the detailed representation deflects the participants from the content of the planning proposals. On the other hand, discussion with the facilitators enabled the participants' attention to be returned to the content. Thus, for example, the materials for individual items of equipment were discussed. In the case of the paper-based form of presentation, the materials were supposedly easier to identify and therefore less of a subject for discussion during the inspections. However, the participants scarcely focused on the detailed representation.
The analysis of the questionnaires also shows that participants evaluate visualization with the augmented reality application more highly than 2D or 3D plans. In the augmented reality group a higher increase in knowledge of the project was found. By comparing the different planning context of both field tests it could be shown that augmented reality is very suitable especially for complex planning projects, which require substantial imagination on the part of the participants. The application of the AR tool shows potential in terms of communication in the interface between planning and people. The results of the qualitative research demonstrate that the details of the planning proposals, with regard to content, can be observed and discussed in greater detail by using the AR tool. The planning proposals can be interpreted more realistically in terms of the spatial implementation.
AR influences the communication process during participation
One consequence of using the new technology was that the parties involved turned to one another less, as they dealt more with the technology or medium. This has advantages and disadvantages: as already illustrated above, the AR tool led to those taking part in the inspections discussing the planning content more than in the case of the paper-based form of presentation. On the other hand, the discussion related more to the representation, the tablet and the process facilitators. The discussion therefore had a greater bilateral or even hierarchical form. In the case of the paper-based form of presentation, the participants were encouraged to refer to one another and to discuss things with one another more.
In terms of the target groups, the qualitative research cannot make any clear statements about whether certain age groups are more or less integrated into the processes, or excluded, by the different forms of visualization. It was simply shown that the AR tool appealed to younger people, which probably has more to do with the question of whether people have access to new technologies or not. The research shows that the AR tool appealed more strongly to technology-aware people and that they were able to integrate themselves better than people who were skeptical of new technologies. It was therefore possible to establish that the AR tool can appeal to different target groups than the paper-based form of presentation. By using different participation tools, it is therefore possible to increase the diversity of the parties involved in planning processes. However, it must also be assumed that this phenomenon will reduce once technology becomes established in all areas of life.
CONCLUSION - AR IN PARTICIPATION PROCEDURES
There follows a final summary of the advantages and disadvantages of using mobile AR instruments in participation processes. The use of the augmented reality app in the field tests has proven that this new tool can be (easily) integrated in participation procedures and enhances the quality of the participation process.
AR is (relatively) easy to implement in planning and participation procedures
There are a number of necessary steps involved in moving from two-dimensional plans or three-dimensional models to the augmented reality model (Reinwald et al., 2013). If augmented reality is introduced as an additional communication and participation tool early in the participation process, it can more easily be integrated into an ongoing project. When developing the app we made an effort to use commonly used interfaces and free software. Using the free Metaio Mobile SDK for the development of the app satisfies most of the necessary functions (fast and stable visualization of 3D models, a stable implementation of the device localization, LLA code recognition etc.). The augmented reality model can easily be constructed with the popular Google Sketchup Pro tool, which enables DXF and DWG files to be imported from traditional CAD programs, and also enables the data for the augmented reality framework to be exported in the required format. It has been shown that the basic elements of an augmented reality model can be developed with pre-existing and popular programs.
Once the app is developed, setting up augmented reality as a field test is quite easy. Only a small amount of information in addition to the three-dimensional model is needed to set up a working augmented reality environment. You need a model including textures, location, orientation and a POI where the model should be placed. The necessary download volume is also very low because the files only need to be downloaded once and no further data connection is necessary.
The use of open source or freely available software and the consideration of regularly used data interfaces assist in the use of augmented reality. The use of three-dimensional models is now considered standard, especially within complex and large planning projects. If the decision to use augmented reality is made early during a planning project, the additional effort required is low (e.g. model with reduced details for the augmented reality framework).
AR reduces the possibility of using renderings to "manipulate" and helps to understand spatial impacts more easily
Using an augmented reality application which relies on GPS for providing location-based information has an advantage over systems which employ LLA markers. It is possible to move freely within the entire model. This illustrates the advantage that you can look at the planned projects from all directions and at eye level. This is an improvement over traditional renderings presented on paper. In traditional renderings the preferred point of view is usually aesthetically pleasing. Through the use of an augmented reality app the possibilities for manipulating perspectives are reduced. In comparison to three-dimensional models, augmented reality gives you the opportunity to experience a proposed plan at eye level, rather than through overhead views. Augmented reality also reduces the effort needed for the development of three-dimensional objects. Only the planned changes have to be visualized. It is no longer necessary to create a model for the surrounding area. Due to this, augmented reality can also provide a better indication of the height of buildings or different ground levels.
Even planners sometimes find it difficult to imagine the spatial impact of a planned project. The idea, here, was that augmented reality could also be used to experience an area from different perspectives. We developed a "child's perspective" (height of a seven to ten-year-old child). In the child's perspective mode the height of all objects in the three-dimensional model is doubled. The user of the app can adopt a child's perspective in order to better understand the visual barriers facing a young child. For example, we realized that the planned flower troughs in the Wallensteinstrasse were placed in a problematic position for young children because it was not possible to see cars on the street, and the car drivers could not see the children.
AR is still at an early stage and further research is necessary
Carmignani and Furht stated that "AR is still in its infancy, and, as such, possible future applications are infinite" (Carmignani & Furht, 2011, 38). This quote aptly describes the development of AR over the last few years. Many (commercial) ideas and possibilities have appeared on the market - most too abstract for effective implementation. Some aspects that influence AR development, such as the inaccuracy of the GPS signal, deviations of up to 7-8 m being possible, are likely to persist for the foreseeable future. However, there are ways to overcome these obstacles: for example QR codes or edge detection within real-world pictures to improve the position of information labels or three-dimensional objects in an AR browser (Grasset et al. 2012). AR is seen as a marketable new tool - especially in the planning and architectural sector (Lang & Sittler, 2013).
The fast development of ICT including augmented reality is "providing a window of opportunity for citizens' participation in urban planning" (Saad-Sulonen, 2013, 111). A wide range of instruments that offer opportunities for informing people, consulting them or involving them in the planning and decision-making process are readily available. The establishment of new opportunities in urban planning and participation has changed our planning culture, and digital media and has become commonplace to many people (Horelli & Wallin, 2013, 154).
The new augmented reality tool expands the repertoire of methods in participation procedures (Broschart et al., 2013, 123). This study - especially the two field tests - has helped to gain applied and practical experience with augmented reality. This new planning tool assists in participation processes. It can be concluded that (1) participants are interested in becoming more involved in the processes that actively change their environments, (2) predominantly younger and male participants are the target group for AR, (3) both visualization methods are effective in informing people about a particular planning project, although AR is evaluated more favourably and (4) AR is especially advantageous if planning projects are more complex.
But there is still a lot of work to be done before mobile augmented reality applications are commonly used in participation procedures. Augmented reality apps have the potential to support many phases of a planning process, not only the presentation of a visualization of the results of a planning process, as tested in the field tests. To expand the possibilities for AR apps and for future development, the following aspects should be the focus of concentrated research:
- Applications should be more simple, user-friendly and easy to operate for participants' own use,
- Participants should be able to offer and exchange ideas and submit statements,
- Additional information should be downloadable and
- It should be possible to modify the basic 3D models.
NO ONLINE WITHOUT OFFLINE
"With the rise of the Internet, it was expected that eParticipation could overcome the limits of traditional forms of citizen participation in urban planning. But many case studies show that this did not happen. Often the technical tools created new barriers to access." (Kubicek H., 2010, 190). The inter- and transdisciplinary cooperation between traffic planners, landscape planners, researchers, social scientists and technicians has helped to overcome this challenge to an extent. The field tests have shown that the use of AR supports the "translation" of planning contents and also adds to the conventional toolset of instruments used in participation procedures. The tests also highlighted that "Online does not work without offline!" (Boschart et al., 2013, 125). That means that both are needed: traditional participation tools such as meetings and discussions with real people as well as new methods and instruments that serve to improve the provision of information.
Different strategies and tools are needed to meet the different requirements of the individuals and groups who depend on the particular environment and living space (Gurstein, 2007, 36). The test cases have shown that augmented reality could engage individuals and communities to get involved in urban planning and participation procedures. It enables people to better understand planning projects and especially the impact on the built environment. For the future development of augmented reality apps the focus should be on the "effective use" approach (Gurstein, 2003), to better meet the users' needs that became apparent in the field test. Lessons learned from the field test in Vienna - such as the integration of web 2.0 instruments to enable exchange within communities or add interactive elements to co-create the design - could be starting points.
Acknowledgements
Ways2gether project partners :
DIGITAL - Institute for Information and Communication
Technologies, JOANNEUM RESEARCH Forschungsgesellschaft
mbH, (Project Leader); Institute of Landscape Planning -
University of Natural Resources and Life Sciences,
Vienna; MJ Landschaftsplanung e.U.; Kompetenzzentrum
für Soziale Arbeit GmbH - FH Campus Wien;
verkehrplus - Prognose, Planung und Strategieberatung
GmbH; Forschungsgesellschaft Mobilität - Austrian
Mobility Research FGM-Amor gemeinnützige
Gesellschaft m.b.H.
Financed by bmvit (Federal Ministry for Transport, Innovation and Technology) within the program ways2go, 3rd Call (2010)