Empowering Newcomers with Low-tech Workshops and High-tech Analyses
- Assistant Professor, Community and Regional Planning, Iowa State University, Iowa, USA. E-mail: katiab@iastate.edu
- Associate Professor, Landscape Architecture, Iowa State University, Iowa, USA.
INTRODUCTION
Scholars and practitioners recognize the need to empathize with 'the other' and customize participatory processes to account for different socio-cultural needs (Umemoto, 2001; Lane, 2005). Little, however, has been written on public participation in 'rural new gateway' communities. Rural new gateways are those communities in the United States that were transformed in the 1990s by more than 100 percent net increases in their foreign-born populations coming directly from abroad rather than from traditional interstate settlement destinations such as California, Florida, Illinois, New Jersey, New York or Texas (Bump et al., 2005, 21-33). Explanations for the demographic changes in these rural new gateway communities include: United States immigration laws and policies that legalized the status of nearly three million undocumented persons in 1986 (Massey, Durand & Malone, 2002); settlement patterns that reflect desires for better schools, lower crime, more affordable living and higher quality of life (Fennelly & Leitner, 2002; Fennelly, 2005); changing labor markets; and shifting corporate recruitment practices (Parrado & Kandel, 2008). Extant ethno-racial research primarily uses electoral participation as an indicator for overall civic engagement, and focuses on socioeconomic status, psychological orientations, social context, and resource mobilization to explain the participatory behaviors of mainly Anglos and rarely Latinos in the United States (Marschall, 2001).
Rather than continue to focus on indicators of integration into community life, or conversely segregation, we instead focus on an integrative process. As Denton suggests, "... to move from segregation to integration requires thinking about process, rather than looking at how much or little segregation indices change" (2010, 25). Denton notes that local demographic change alone-the result of current minority groups becoming majorities in the future-may force more integration. Regardless of whether this actually occurs, we agree with Denton's suggestion that integration policies must be space-specific-that is customized for specific spatial contexts. We suggest that community informatics is fundamental to facilitating positive change by increasing involvement in integrative processes. We extend Denton's work with a place-specific participatory process and analytic tools that can help determine potential venues for inclusive community decision-making as a means toward integrating newcomers.
Our research contributes to the scholarship of community informatics, urban planning, and newcomer integration in local governance. As in other rural new gateways in the United States, the newcomer population in Perry, Iowa, since the 1990s, consists primarily of Latinos. Efforts to integrate new Latino immigrants and encourage their participation in community affairs abound. And yet, institutionalized integration efforts continue to flounder (Trabalzi & Sandoval, 2010; Rioz & Vazquez, 2012).
Rural American towns, in general, differ from large cities in terms of size, attitude, economic base, appearance, and aspirations (Daniels et al., 2007). Rural new gateways have additional unique circumstances, but share the characteristics of rapidly changing demographics, similar physical geographies, and comparable administrative and financial capabilities. Civic engagement strategies need to reflect these characteristics. We suggest that the following research question will provide important insights into the involvement of newcomers in American new gateway communities: With what processes and methods can newcomers in rural new gateway communities be empowered to participate in local governance and how do these processes and methods relate to planning and community informatics?
This article reports on community-based participatory research that was empirically tested in a particular rural new gateway and was designed to alter patterns of participation in local governance. Described within is a low-tech workshop methodology that facilitates sharing knowledge about community resources, particularly where people go to discuss community affairs. The next section of this article builds on the idea of integrative, participatory processes, by profiling research that explores the intersection of civic engagement and the use of information communication technologies. The data generated during the workshops are then analyzed using a high-tech Geographic Information Systems (GIS) modeling process. Maps are produced that help communities visualize and understand how, and by whom, certain spaces are used. The maps allow community leaders to identify and select more inclusive venues for public meetings and create opportunities for more diverse participation in local governance. We suggest that the low-cost, low-tech workshop methodology discussed in the article is readily transferrable to other rural new gateways. In addition, while the analysis may be considered 'high-tech', the GIS processes described here were designed to be easily customized for use in other communities. The article concludes with a discussion on the practical implications of the methodology's effectiveness and its replicability.
METHODOLOGICAL BACKGROUND
Local city or town halls, although traditionally intended to serve as central locations for decision-making, can alienate newcomers (and established residents) with their physical arrangements and formal meeting rooms that reinforce arcane communication styles (Innes & Booher, 2004). In fact, as our research demonstrates, people often find alternative locations to discuss community-wide issues. Certain places are inherently conducive to these sorts of discussions; others are not. We call the places that are widely accessible for a variety of uses and users 'civic spaces.' Civic spaces allow for discussion of any topic and generate engagement in social relationships. Douglass, Ho, and Ooi define civic spaces as: "those spaces in which people of different origins and walks of life can come together without overt control by the government, or by commercial or other private interests, or the de facto dominance of one group over another" (2002, 346). Local matters need not be discussed in only public places, but may also be addressed in privately-owned spaces or those managed by non-profits. People also discuss community affairs in private residences, but for the purpose of this article our focus is on those places that may accommodate face-to-face discussions, can comply with open meeting laws, and can be made more inviting or inclusive with public investment.
Operationalizing a normative concept of civic spaces, Saad-Sulonen and Horelli (2010) examine the relationship between participation and technology in governance, urban planning, information systems and interaction design; citizen activism; and community development. They conclude that information communications technologies (ICTs) can facilitate participation in urban issues. For example, cognitive maps (also known as mental maps) are a form of ICT-mediated citizen participation tools that metaphorically describe how people acquire, organize, and store information in their minds. Although there are other participation tools that lend themselves to linking participation and governance, geographic information associated with civic spaces-revealed through cognitive mapping exercises-can serve as a starting point for value-driven discussions and information sharing about community planning and development (Manzo & Perkins, 2006).
Our research builds on the work of two kinds of cognitive mapping that are commonly put into practice with technology for displaying and analyzing information: asset mapping (McKnight & Kretzmann, 1993); and power or stakeholder mapping (Bryson, 2004; Noy, 2008). Asset mapping results in identifying physical and intangible community strengths. Power mapping is compiled in a series of tables, concentric circles, or Venn diagrams and illustrates political relationships, or the relationships of stakeholders. Power and stakeholder mapping, unlike asset mapping, is not necessarily linked to a particular geography. In comparison, our research offers a spatial approach demonstrating that the selection and use of physical spaces by community members reveals power, or the lack thereof.
To generate reliable and useful information, urban planning practice must be customized for the intended population (Innes, 1995; Sandercock, 1998; Umemoto, 2001). For example, certain immigrants to the United States may never have participated in a participatory, public process or been asked to discuss topics potentially fraught with conflict. With such populations, cognitive mapping can potentially stimulate deeper discussion or engagement. Along these lines Bradley and Scheider (2004), for instance, suggest:
"Creative and visual stimuli like pictures, diagrams, colours and physical activities increase the effectiveness of dialogue in any group ... because they engage the more powerful right side of the brain, allowing the full potential of the brain to be used for perceptive analysis [and] visual methods tend to be more inclusive and democratic, since everybody is able to express their opinion directly [and] visual methods can also be used to manage conflict. Participants can be encouraged to address their arguments to the diagram, rather than directly confronting each other." (33-34)
Cognitive mapping can also help people gain control over their own lives. For instance, Parker (2006, 477) summarizes the thematic literature associated with how mapping can empower individuals and communities as follows: "(1) the ability to self-define and represent place; (2) the acquisition of control over natural or other resources; and (3) the mobilization of collective action" (e.g., Aberley, 1993; Peluso, 1995; Clifford, 1996; Lydon, 2003; Offen, 2003). The process of cognitive mapping can therefore be as beneficial as the data generated. This mapping approach has relevance for newcomers in gateway communities because newcomers typically feel less empowered than established residents (Jupp, 2008).
Customized participatory processes can empower individuals and institutions if participants play an active role in the research. Community-based participatory research, a variant of participatory action research (McIntyre, 2008), ensures cultural and community specificity and creates new social relationships between participants that can potentially alter participation in governance. Community-based participatory research generates data and involves a process that directly benefits participants. The participatory process that was tested in Perry and described herein involves a community-based participatory research approach.
Although it is now common for communities in the United States to express strong interest in broadening and deepening participation in governance, the primary means for generating participation still falls under the aegis of 'open government' processes such as: publicizing meetings, voluntary service on boards and committees, and engagement with the election process (Zukin et al., 2006). Newcomer integration in local governance can be facilitated with the implementation of participatory planning processes under the umbrella of ICT. Adapting participatory techniques from the disciplines of community informatics and urban planning, we explore an approach, as O'Neil (2002) has, that links ICT uses to normative aspirations associated with building social capital and enhancing democracy. We argue that the participatory processes must account for limited administrative and financial flexibility, changing demographics, and unique physical geographies in rural new gateway communities in the U.S. The discussion above suggests the potential for linking civic engagement and ICT praxis. In the section that follows we demonstrate how both ICTs and civic engagement are being adapted in the case of a typical rural new gateway community.
THE CASE STUDY SITE
Perry is a small city in central Iowa's Dallas County with a population of 7,702 (U.S. Census, 2010). Perry was selected as the study site because it met the criteria of a typical rural new gateway-namely, a rural community that has undergone rapid demographic change as a result of becoming a first destination for foreign-born immigrants.
Located 50 miles northwest of the State of Iowa's capital of Des Moines and surrounded by farms, Perry is on the edge of telecommunications connectivity. As discussed by Bilandzic and Venable (2011), ICT has become an established component of our cities, infrastructure, and daily environments, but the digital divide still exists for the elderly, poor, disabled, and residents of rural communities in the U.S. (NTIA & U.S. Dept of Commerce, 1999).
"The economics of providing telecommunications in rural areas are vastly different than in urban areas-especially for broadband technologies, such as DSL and fiber-to-the-home. With fewer business customers (usually, less than 10% of the total) and much lower population density, the cost of rural telecom networks averages five times that of urban networks" (RIITA, 2009, 5).
The broadband service inventory map of Dallas County indicates that Perry has access to cable broadband, fixed wireless, and DSL broadband, but its neighbors are limited to wireless or DLS broadband services (Connect Iowa, 2012). While there are a total of five broadband service providers in Iowa, Perry has only three providers and its adjacent surroundings have two or fewer providers (Connect Iowa, 2012). As of this writing there are only two types of broadband technology in and around Perry (Connect Iowa, 2012). In sum, as in other American rural communities not directly adjacent to urbanized areas, access to broadband providers, services, and technology to Perry and its more rural neighbors is limited.
Apart from the limited telecom connectivity, another typical characteristic of rural new gateways is their circumscribed administrative and financial situations. As Daniels et al. (2007) report, the biggest shortcoming that small American towns face is limited financial and human resources. For example, the City of Perry has no planner or information technology person on staff, but receives support from county officials or contracts out assistance. It also partners with the local universities to supplement community planning and development efforts. Unlike a large city, it is difficult for small communities to shift resources from one budgetary line item to another. Thus, regularly conducted planning and analysis activities cannot be expensive and must carefully rely upon a combination of local assistance or partnerships with colleges and universities.
Perry's population is multicultural, with Latinos comprising the largest minority group. Perry's primary employer, a meat packing plant located on the city's western border, began recruiting Latino immigrants in the 1990s as a means of lowering labor costs. In 1990, 47 Latino people resided in Perry, compared to 2,692 in 2010, or approximately 35% of the city's population (U.S. Census, 2010). Businesses catering to Latino households' needs were established following their uptake of meat packing jobs. The Latino population continues to grow and Perry is now home to many second-generation Latino families. The percentage of Latino schoolchildren is just over 40% (City of Perry School District, Annual Report 2012). It is now common to find employees fluent in both Spanish and English in the public sector and in the larger businesses throughout the city. And yet, the Latino population has had little say in the decisions that guide Perry's future. Perry's experience is similar to those of other rural new gateways, that is, with many foreign-born immigrants, the city struggles with incorporating newcomers in local governance processes.
Opinions regarding the degree to which Latinos have been welcomed and integrated into Perry vary widely. Apart from the occasional programs designed to promote dialogue, like 'study circles' sponsored by a coalition of civic and government groups to discuss population changes in 2005 (Swilky & Newman, 2007) and a 2006 visit to Michoacán, Mexico, by city and civic leaders (Sandoval, 2012, 58), the public sector regularly attempts to recruit bilingual workers. Spanish-speaking employees facilitate access to services, and in the private sector, attract a more diverse clientele. Perry also has various organizations that administer social services for low-income or underprivileged populations-more of whom are Latino, as Latino households earn less than Anglos in Perry.
Social networks linked to broader community matters center primarily on churches, but there are also non-religious civic organizations such as Hispanics United for Perry, the Lions Club, the Rotary, etc. While Latinos have been characterized as not trusting formal public sector institutions (Rios, Vazquez & Miranda, 2012), they recognize the effectiveness of, and participate in, the work of local non-profits. Marschall summarizes this participatory perspective among Latinos in the U.S., as a "combination of low trust and high efficacy that significantly increases their involvement in community life" (2001, 239). Latinos are engaged in local affairs and are committed to community betterment, but do not regularly work to influence decisions made by elected leaders or governmental agencies. As a result, "Latinos' social milieu acts as a critical context for socialization, information dissemination, and mobilization, thereby providing some requisite resources central to facilitating participation" (Hritzuk & Park, 2000, 151). A bridging process between the social milieu and public sphere is lacking.
Furthermore, Perry's residents, like other residents in small, rural communities, engage in passive and active self-segregation (Go?dziak, 2005, 7). Like some Latino minorities, the cautious, self-sufficient, established Anglo residents in rural areas also lack trust in government (Daniels et al., 2007). The rapid pace of demographic change exacerbates the feelings of mistrust among ethno-racial groups in Perry (Sandoval, 2012). Perry possesses all the characteristics of a rural new gateway community-limited administrative and financial capabilities, rapidly changing demographics, and a physical geography that hampers digital connectivity-making it well suited to serve as a case study representing a typical rural new gateway. In the next section, we discuss the empirical methods by which we tested our research question in Perry.
THE WORKSHOP METHOD
Community-based Participatory Mapping Workshops
A low-tech, community-based participatory mapping approach, customized to reflect the characteristics of rural places, was developed in this study to identify places used for informal discussions about community affairs and the salient characteristics of these places. The approach was also intended to empower individuals and civil society organizations by providing forums for information sharing about community resources. Overall, the approach was intended to be easily transferrable to other U.S. gateway communities and to be an analytic process that is both replicable and adaptable.
In spring and fall of 2012, 96 participants (54 Latinos and 42 non-Latinos) attended one of ten workshops that we were involved in organizing in Perry. Each workshop used the same format, namely, a set of exercises that participants could complete within one and a half to two hours. Regardless of how many people attended each workshop, participants worked in small groups of five to seven persons. Members of local organizations participated in developing the research design and ultimately hosted the workshops-that is, they invited participants, promoted the event, and provided the venue. Local hosts included churches, social service providers, private social clubs, University Extension service providers-the latter of which included university employees who engage citizens and provide assistance through research-based educational programs, and the local recreation center. We anticipated that taking a leadership role in this project could signify an organization's commitment to creating opportunities for engagement in community issues and improving the community's overall livability.
Working with local leaders and colleagues at the university-and drawing from research associated with culture-specific communications (see for example Sandercock, 1998 and Umemoto, 2001) and U.S. Census data (as interpreted by Bump et al., 2005, 34-40)-we identified a target audience, developed demographic profiles, and established a logistical framework to structure an approach for improving civic engagement with Perry's Latino community. For example, the language and education abilities of the target audience dictated that the workshops be offered in English and Spanish and that written instructions be supplemented with verbal ones. Consensus was not sought, as consensus generally privileges the opinions and needs of speakers trained in the form of making rational arguments (Zapata, 2012, 158).
Because meatpacking employees recruited for working in Perry have settled into the community with their extended families, accommodations were made for gender, age and intergenerational differences. Maldonado's and Licona's (2007) research with Latina immigrants suggests that women have smaller circles of acquaintances and limited mobility compared to men. Cost issues coupled with a commitment to the cohesive familial unit might prevent one family member from leaving the home without other household members. Additionally, the household may be a way station for new migrants, documented and otherwise, and not contain people who are all directly related by blood. As such, in order to maximize participation, entire households were invited. Workshops were designed to replicate the comfort participants find in group activities, as opposed to an interview format that forced individuals to be alone with interviewers.
Youth (ages 14-17) were encouraged to participate in the workshops, and on-site care was offered for younger children. Including youth was a means to facilitate a household's participation and also ensured that youth were represented. Like minority ethnic populations, the perspectives of youth are underrepresented in community planning efforts in the U.S. (Kelly & Becker, 2000). Even in planning or engagement activities to meet the needs of youth-such as park design and school systems-youth rarely participate. Planning and public policy efforts "underplay the potential significance of everyday informal participation of young people in community life and in the construction of a shared experience" (Head, 2011, 542).
In the approach we are studying here, workshop facilitators included local residents and university students and facilitators were trained and provided with written instructions (including an explanation and reason for each exercise). The instructions were drafted and field-tested with local residents during 2012. Apart from introductory and concluding remarks (including a request to complete an exit survey before departing), the participatory exercises were organized sequentially as follows:
- Brainstorm Important Places and Their Characteristics. During this stage, participants brainstormed a listing of places they could go to discuss community issues, and discussed the functionality and attractiveness of each place identified. Facilitators subsequently asked a series of eight questions to reveal the degree of placemaking at each community place.
- Generate Categories of Important Places. During this stage, participants created categories of spaces identified in the first task (above) and assigned each space with a category or multiple categories (e.g. schools, parks, restaurants, municipal offices).
- Create Personal Maps. During this stage, participants were each given a printed black and white street map of the city and asked to circle the location-using the previously agreed upon categories - where they actually go to speak with others about community affairs.
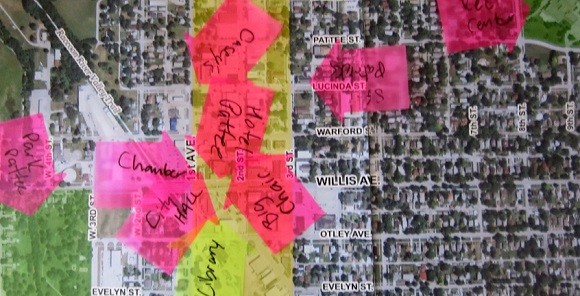
- Create Group Maps. During this stage, participants worked in small groups on large four-by five-foot aerial photos to identify the places they collectively go to speak with people. They also identified where 'others' go, that is, places where they themselves may go, but where they also see other people of a different demographic gathering.
- Identify Most Important Places. During this stage, participants were given self-adhesive dots, and asked to revisit the places identified in the brainstorming exercise and asked to apply dots to three priority places.
The five exercises were iterative in that participants could revisit and amend previous statements, and somewhat repetitive to illicit deeper thinking with each subsequent task. The tangible workshop products included: individual and group maps illustrating where people discussed community matters; the characteristics of key meeting places; how participants prioritize their identified places; observer notes capturing nonverbal forms of communication or comments that record group interactions and responses; and exit surveys designed to assess perceptions of the workshop. A municipality can use the data collected through this project to make local governance and civic engagement more inclusive. The workshop design-low cost; low technology; customized towards the needs, interests and abilities of a target audience; and using existing social networks-was intended to align with the characteristics of rural new gateways.
Although the research findings were assessed using analytic software, the workshops did not require any computer software or hardware to implement. Participant volunteers recorded brainstorming results on paper note cards and large paper pads on easels. Participants documented the places they go to discuss community matters with pens on paper street maps and with self-adhesive arrows on large aerial photos of the city. After a two-hour training session, and with the help of a bilingual 'Facilitator's Guide,' students and local residents were able to facilitate groups of five to ten participants. Paid consultant-facilitators were not needed. Having seen how paid consultants had previously alienated participants in a project to update Perry's comprehensive plan, we believed, and the exit surveys confirmed, that participants were comfortable with less-polished facilitators being involved in this workshop engagement process.
Workshop Findings
The community-based participatory approach effectively identified places used for informal discussions about community affairs, and the salient characteristics of these places. Although the number of participants at the ten workshops varied, the workshop process itself generated the interaction and data we had anticipated. In particular, workshop participants collectively identified more than 176 places in Perry where people discussed community affairs, of which 134 locations were identified once, 13 locations identified twice and the remaining 29 locations identified by three or more individuals. The focus of the remainder of this article is on the workshop process and related analytic efforts whereas what the data reveal about civic spaces in Perry has been summarized elsewhere (Balassiano & Maldonado, 2013).
In the workshops participants exchanged information about the quality of the places they identified on the maps. In comparison to the places participants identified alone, the group work generated more detailed, specific information. Working as a group, participants exchanged information about community resources and often corrected one another in the process or provided more nuanced, experience-based information. Exit surveys revealed that the participants thought the process was well organized and informative. Although we have yet to connect participation in such workshops to participation in local governance, we are satisfied that the workshop approach empowers individuals by facilitating the sharing of community-specific information that does not always get disseminated by way of physical bulletin boards or websites.
Besides empowering individuals in Perry, the workshops and data analysis strengthened existing civil society organizations and the linkages to local universities. Various voluntary and mandatory processes designed to engage the citizenry in rural communities in general already exist and some of these processes are institutionalized within the public sector while others are initiated by civil society, or more specifically, non-profit organizations (Sanoff, 2000; Creighton, 2005; Kelly & Becker, 2000). However, over time such organizations can lose the energy or momentum with which they were formed. The task of hosting a local engagement workshop can demonstrate an organization's continued commitment to helping members. Similarly, institutions of higher education have a variety of reasons for partnering with local communities ranging from altruistic to the need for 'learning laboratories' that connect theory to practice for research and teaching. In accordance with community-based participatory research, the workshop approach and analysis (described below) sought to ensure that university involvement benefited the community and researchers (and their faculty).
THE METHOD OF SPATIAL ANALYSIS AND INTERPRETATION
While the low-tech approach to data collection and participant interaction provided the opportunity for extensive dialogue and data collection, it also resulted in a significant amount of analog data that could not be easily visualized and analyzed. With the aim of synthesizing these data the researchers established protocols for recording the results, allowing the information to be digitized and entered into a GIS for identifying and ease of communicating visual patterns. The spatial analysis protocols established for the workshops included assigning each workshop, participant and group table a unique multi-digit number-for example, table 2 during workshop 3 would be assigned the number 0302-to ensure that any record could be quickly identified and not convoluted with other data. A participant would be assigned a number such as 03020087, indicating that they were participant 87 sitting at table 2 during workshop 3. This information, along with participant age, gender, and ethnic information gathered through the survey, made it possible to identify the overall compositions of table groups. Data was recorded in a tabular format compatible with GIS standards to ensure that the information could later be imported and linked to any spatial information that the participants had provided.
During the workshops, participants identified where they actually went to speak with others about community affairs on paper maps. Later this was transferred into the GIS by manually digitizing the points over an aerial image of the community. Each point included the category and participant's unique ID. Points were placed exactly where the participant marked them on the map even if the location was incorrect by a few blocks. Once all points from the personal maps had been entered into the GIS, the data set was copied and a new reference map was created containing datapoints for each categorized item submitted. Using the reference map as a base, the map containing the copied data was edited and the points located by the participant were moved to the correct location. This step served two purposes: first, the 'points map' increased the accuracy of subsequent spatial analyses; and second, the original and the edited file could be analyzed for any trends involving the participants' ability to map the locations they visited.
Digitizing the data produced during the group mapping workshop exercise followed a similar process. The groups identified locations where they went using one set of colored arrows (sticky notes) on the map and the locations others went using another color (Figure 1). Each arrow's location and color was subsequently transferred into the GIS. Once the individual and group maps were digitized and linked to workshop participant demographic variables, the data were organized and analyzed with ESRI's ArcGIS Desktop software. Results were not normalized for this pilot case study, but could be for future comparison of demographic groups across municipalities. However, given that this was applied research was intended primarily for the benefit of communities and that the locations where people gather were unique to a particular community, normalizing the data is not of primary importance. The remainder of this section discusses the data analysis modeling and various GIS procedures used in analyzing the paper map data derived from the workshops.
Analysis model and the need for a uniform grid
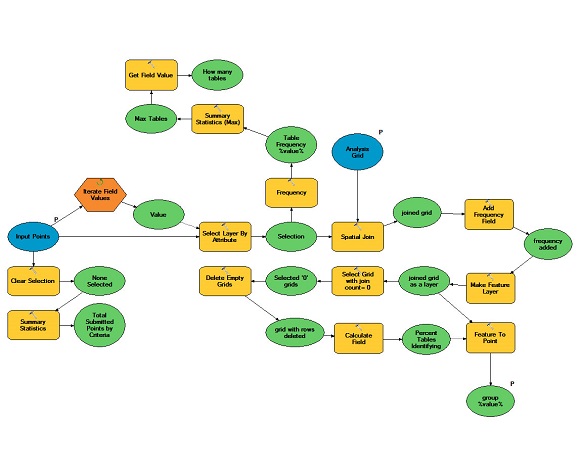
During the data analysis process, it became apparent that repeating GIS functions each time a variant on the analysis process was tested would be extremely time consuming and increase the likelihood of error. Furthermore, the GIS steps needed to be easily replicable, adaptable for use with different variables, and quickly and consistently able to analyze data in order for the study to be replicable in other settings or with different demographic groups. The researchers solved this problem by generating a series of process models using ESRI's 'Model Builder' software. These models allowed for input parameters to be adapted to differing research questions and unique spatial characteristics of the study area. Following is a brief description of the components contained in our analysis model.
The first step of the analysis was to transfer the point data into a grid cell system that could enable easily quantifying the number of points occurring at a given location. The Fishnet grid tool is a simple, efficient geoprocessing tool that requires only a cell size and a defined workspace (ESRI, 2014). The tool expedites grid creation so that several grids of various sizes, representing multiple sets of input data, may be generated quickly. The 'Create Fishnet' function allowed for the creation of a uniform grid of 57,200 - 15-square-meter cells in and around Perry. The analysis grids were used to calculate the number of times participants identified a particular location. Therefore, each cell was comprised of its own inherent values, without reference to the values of surrounding cells. Populating cells with values allowed us to conduct a point pattern analysis with the entire body of points, or data set, and then display data in the form of frequencies and heat maps (Chou, 1997).
Although capable of producing these uniform grids, the default ESRI 'Fishnet' tool was deficient in two areas when run as an independent tool. First, the grids generated often failed to include all of input points, primarily because of the location of the origin and cell size. Thus, points that fell directly on the cell boundaries, rather than within them, were omitted from the output. While it was possible to set an initial extent parameter, this approach did not allow the grid to be dynamically generated from the data points. The solution was to utilize Model Builder and create a tool that would generate a bounding box that encompassed all of the points and then buffer this box by a distance equal to the specified cell size used for the study grid. The resulting grid included both the area within the boundary box as well as the buffered bounds area, ensuring that no points were excluded, thereby improving the accuracy of the analysis.
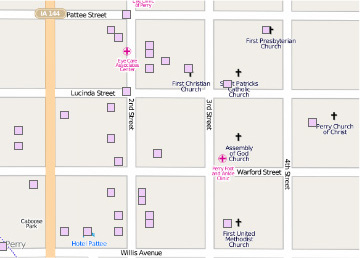
The second limitation was that the output polygon grid was CPU intensive when generated with a small grid over a large area. To overcome this issue, the output grid was generated in memory and then converted into a Feature Layer. Only the grid cells containing an input point were then exported to the GIS workspace. This process ensured that only the relevant grid cells were included (Figure 2). As part of the modeling process, the file name of the output grid identified it as an individual or group grid, and included the cell size as part of the name. More importantly, the tool creates only the grids necessary for the next step of the analysis which involved analysis of multiple data attributes.
Using the 'iterate field' tool for multi-attribute data analysis
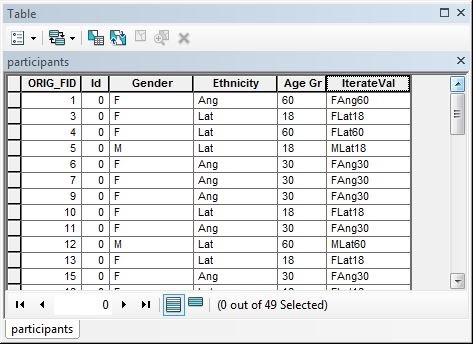
To analyze various data combinations, an additional field containing the concatenate values (participant gender, ethnicity, age group) of categories was added to the attribute table. This new field allowed the GIS researcher to analyze the multiple attributes represented by each unique point. The output was a unique text identifier for each category group that could be used by the software's 'Iterate Field' tool. For instance, a Structured Query Language (SQL) statement such as "Iterate_Field = 'Gender' & 'Ethnicity' & 'Age Group'" could be used to calculate the iterate field if the researcher was interested in the variables of gender, ethnicity, and age group. The resulting value might appear as 'MAng18' for a male Anglo age 18-30 or as 'FLat30' for a female respondent that identifies herself as a Latino person between the ages of 30-50 (Figure 3). This design automated the time-consuming process of identifying all possible combinations of demographic characteristics. In addition, the single step of manually adjusting the SQL statement allowed the researcher to analyze different combinations of variables in order to differentiate where diverse people went to discuss community affairs in Perry.
Individual workshop member spatial analysis model
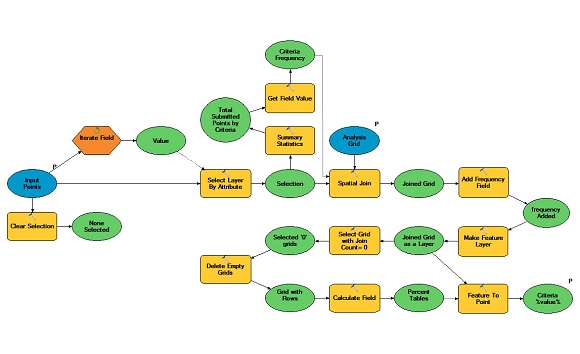
Once those records matching the value provided by the 'Iterate Field' process were selected, the 'Criteria Frequency' was determined and later used to calculate the overall frequency of the location in the model (Figure 4). Selections were spatially joined to the previously produced analysis grid, a frequency field was added to the table, and the map layer converted to a 'Feature Layer'. To increase the model's efficiency all grid records with a count of zero were deleted. The frequency of a location was calculated by dividing the 'Count' field by the 'Criteria Frequency'. Finally, grid polygon features were converted to point features and saved to a defined workspace. Each exported file included the criteria value as part of its name. For example, the density of the male Latino population age 30-50 would appear as 'DensityMode_MHis30'.
Group workshop member spatial analysis
The group analysis portion of the project utilized a process similar to that of the individual analysis, but with fewer points representing groups. As previously described, individuals were grouped by tables during the workshops. Each table's participants identified the places that they went to, as well as the places where they believe others went. This necessitated that the model identify the total number of tables that met search criteria so that, in turn, the percentage of tables identifying locations where people went to discuss community affairs could be calculated. Frequency values were determined by dividing the total number of points meeting each criterion by the number of workshop tables meeting those criteria (Figure 5). The 'Get Field Value' tool provided the functionality necessary to complete this step; however, this tool is only available within ESRI's Model Builder and cannot be run as a stand-alone tool (ESRI, 2014).
The flexibility of the models allowed the researcher to rapidly generate new analysis grids, meaning that the model could be customized to address the specific geographic characteristics in a particular community. Furthermore, as community demographics continue to change, the researcher can quickly generate new analyses, using various grid sizes and different sets of criteria. Analysis of a new data set only requires that a new field containing the calculated criteria (the 'Iterate Field' function) be created to characterize the record. For instance, a researcher can examine spatial patterns among all male workshop participants or all Latino workshop participants, or perhaps all male Latino participants ages 18-30.
Visualization
The symbols used on the resulting maps were chosen so that patterns and trends were easily recognizable. Points were represented as hollow circles, allowing points to be seen even when they were overlapping. The size of each symbol corresponded to the percentage of the study population represented. This symbology creates clarity and continuity across maps of various scales. The scale changes with the size of the grids used. As analysis grids increase in size the percentage of activity within that grid increases. Thus, it would be inappropriate to compare (visually) 15m and 100m maps unless they both used the same symbology scales. With the interactive tools built using Model Builder software, new data sets with the appropriate symbology can be quickly created. Thus, the interface becomes portable and widely transferable.
The spatial arrangement of point features-their locations and relationships quantified by proximity-generated a distribution or pattern that can be characterized as clustered, scattered, or random. In Perry, the point features correlated with land use density and large use generators (the places people go) on the outskirts of the city center. The clustering of points was particularly evident in, and proximate to, the central business district. Scattered points illustrated the location of the schools, recreation center, hospital, and strip malls further from downtown. Another arrangement was less obvious, but coincided with the location of formal and informal recreation opportunities. The recreation center and its nearby soccer fields, the public parks, linear trail and bicycle paths, and a sidewalk system that leads to recreational opportunities revealed a spatial arrangement that was both linear and occasionally clustered.
Generally, the two ethno-racial groups use different locations throughout Perry. Places frequented by both groups include the recreation center, high school, grocery stores, and library. The customized GIS modeling allowed us to examine gender-specific patterns as well. From the visual representation of the data in our analysis, one can conclude that females (Latina and non-Latina) go to more locations in the community than men to discuss community affairs; and yet, the spaces females use are also segregated by ethno-racial groupings (Figure 6).
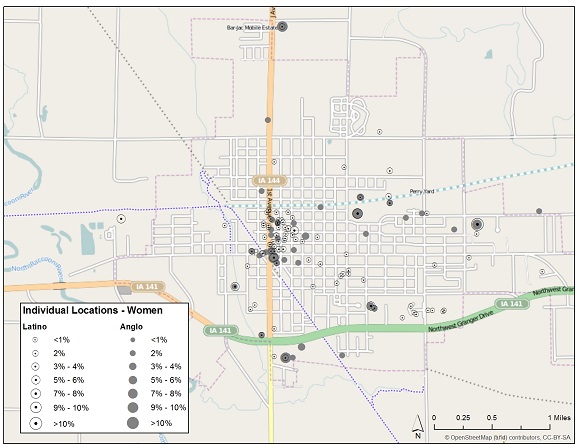
By contrast, men discuss community affairs in fewer places. Compared to men, more women who live in Perry also work there. And thus, they spend more time in Perry, accessing a greater variety of the community's offerings, than do males. Another interpretation-supported by the participant dialogues recorded during the mapping tasks-was that men (Anglo, more so than Latino) used city hall as a primary place for decision-making and dialogue pertaining to public affairs, whereas women engaged in such dialogues informally and concurrently as they satisfied their households' other needs locally.
The combination of point frequency and heat maps indicates both specifically and generally where people go to discuss community affairs. These maps (and methodology when applied in other communities) can be used to determine potential new venues for public meetings-based on a GIS-analysis of places where diverse people regularly go and informally discuss community affairs. In Perry, the most highly frequented places where both Latinos and Non-Latinos discussed community affairs included parks and recreation facilities, the city's larger places of employment, schools, libraries, and civil society organization meeting sites. Figure 7 illustrates that the local recreation center was the primary place where Latino participants went to discuss local affairs.
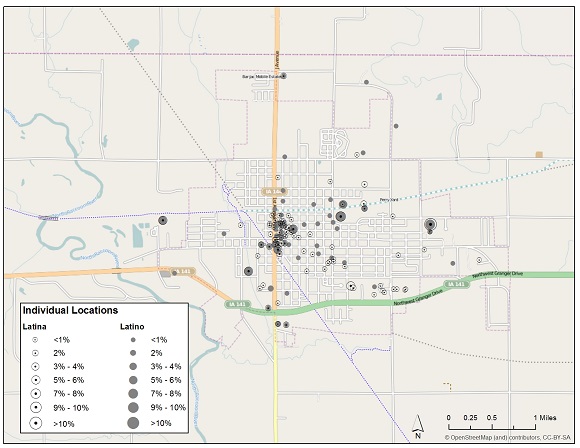
Meeting sites often also coincided with community festivals and events (Balassiano & Maldonado, 2013). The city hall is not currently one of the most frequented places. Community-wide decision-making would generate more inclusive participation if meetings were held in places a diversity people already go to informally discuss community affairs.
In the sections above we introduced and tested a workshop process that deliberately orients newcomers toward participating in local governance. This process also provided a means of GIS-based modeling and analysis that potentially allows for the improved selection of public meeting venues in gateway communities. The next section concludes with additional insights pertaining to the integration of new residents and their involvement in local affairs.
CONCLUSION
Given that traditional methods of engaging the public in planning and local decision-making (Lowry, Adler, Milner, 1997) are often ineffective, and that rural new gateways require an approach to public engagement that accounts for unique geographic challenges, inflexible budgets, limited staff and rapidly changing demographics, our research sought to explore the following question: With what processes and methods can newcomers in rural new gateway communities be empowered to participate in local governance and how do these processes and methods relate to planning and community informatics?
In this article we sought to examine how a 'low-tech' workshop methodology could contribute to integrating newcomers in an American new rural gateway community. As previously reported in an article related to this research in Perry (Balassiano, 2013, 31), rural new gateways in the United States require participatory processes that:
- Do not rely solely on mobile telephone and Internet technologies,
- Are not expensive or reliant upon professional facilitators,
- Respect and reflect the cultures of newcomers and long-time residents,
- Offer alternatives to the passive segregation of the population, and
- Use particular means to circumvent feelings of government mistrust.
Community-based participatory research centered on determining where people go to discuss community affairs. We presented a new 'high-tech' GIS-based approach for analyzing the data and producing maps that could help communities visualize and understand how certain spaces are used and by whom. Our distinct approach blends cognitive mapping and ICT-linked civic engagement, and allows community leaders to create opportunities for more diverse participation in local governance.
The workshop processes described herein satisfy those practical concerns. The workshops should also appeal to those municipalities that are serious about integrating newcomers. Community-based participatory mapping can be tailored to respond to the particular demographic-related needs of newcomers. The approach itself is designed to empower individual participants through the knowledge they gain from others, and by sharing their own knowledge of the community. The project's participatory mapping workshops bring together newcomers and established residents, allowing both groups to exchange ideas and share knowledge about community resources.
While municipal staff and community members can implement the workshops, nearby institutions of higher education can conduct the high-tech spatial modeling. The project utilizes a dynamic modeling process to analyze the data collected at the workshops and generate maps that can be distributed electronically and in paper form. Although the workshops are time intensive, the models, once created, allow for the data to be updated frequently in response to rapidly changing demographics. The combination of low-tech data gathering and high-tech analysis generated specific, actionable data. A critical issue for the GIS analysis was the development of the process models using ArcGIS's Model Builder software. The models allowed the research team to develop several combinations of variables to be used to categorize the data sets by simply setting the parameter in a single variable. The reproducibility of the analysis models allow the location and scale (grid size) to be modified, thus allowing the models to be used in future projects in other communities or with different demographic groups.
University Extension leaders with whom we shared our findings expressed interest in replicating the workshops in other communities. Extension Specialists located in other rural new gateways in Iowa - a natural conduit for connecting to communities - suggested these workshops could meet multiple community needs, but that the Extension Specialists would require such tasks to be formally assigned to them. Both the workshop facilitation and GIS digitizing and analysis work could become the basis for experiential and service learning in the classroom setting. As Thompson (2005) effectively argues, universities have an important role to play in information and community informatics. As the digital divide dissipates, the workshops can be modified to incorporate more technology, thus moving from an information systems approach to urban informatics (Bilandzic & Venable, 2011). Ultimately, we imagine residents of rural new gateway communities initiating and managing both the workshops and analytic process, in a manner more similar to participatory GIS (Dunn, 2007) or facilitated-volunteered geographic information approaches (Seeger, 2008).
Other methods exist that can facilitate the integration of newcomers into communities. Go?dziak and Martin's (2005) compilation of best practices associated with integrating Latino newcomers include programs to facilitate English-language acquisition, access to culturally sensitive and linguistically appropriate health care services, vocational training, and community development. We envision our research complementing these efforts, but also prioritizing physical spaces. As urban informatics theory suggests, place, space, and location significantly affect the user's situated context and experience (Lentini & Decortis, 2010). The spaces where people study English or receive health care are likely to be used for other purposes. The question for designers becomes: 'How can these spaces be improved to encourage interactions and socio-political conversations?' Or, specific to the approach we have described herein: 'Would such service providers consider hosting a workshop?' Recognizing the importance of social service providers and civil society organizations and requesting their assistance is a form of outreach that empowers social networks.
Participation in local governance could broaden and deepen if the spaces where people informally gather become the places where decisions important to the entire community are discussed or even made. Local governments can use the maps generated through the approaches we've described in this article to select venues for more inclusive local decision-making and thus broaden participation in governance. Changing meeting venues is a form of outreach that involves locating meetings where people already gather to discuss community affairs. Such an approach will arguably generate more participation than will standard notices for meetings at city hall.
The places where people gather to discuss community affairs can be understood as 'local resources' that serve to empower individuals and groups by providing or enabling knowledge, spiritual or social companionship, or financial or other physical assistance. The uses of such spaces for participatory workshops can continue to strengthen organizations and, ultimately, communities. Civic spaces are places where newcomers needs' can be met and where community matters are discussed. Our research in Perry, Iowa suggests a deliberate approach involving the targeted uses of GIS mapping can improve the understanding of a municipality's gathering places for civic engagement as resources - thus empowering people and civil society organizations. The approach we have described seeks to generate interest in community affairs and build the confidence of people who have not traditionally participated in face-to-face engagement or community planning.
ACKNOWLEDGEMENTS
The authors would like to thank Dr. Marta M. Maldonado for her assistance with the workshops and extensive knowledge of Perry, Iowa.